


Run data analytics at speed and scale for observability, security, and search with Kibana. Powerful analysis on any data from any source, from threat intelligence to search analytics, logs to application monitoring, and much more.
New to Kibana? Here's all you need to get started.
Watch videoLearn the core concepts of data analysis using Kibana.
Learn moreAre you using all of the features Kibana offers? Master the art of the Kibana dashboard.
Watch videoANALYZE WITH PRECISION & SCALE
Resolve issues faster and scale insights across use cases and teams when you use Kibana for data analytics. Discover insights to investigate threats, monitor systems, and evaluate search performance, and take action, all on one platform powered by the speed, scale, and relevance of Elasticsearch.
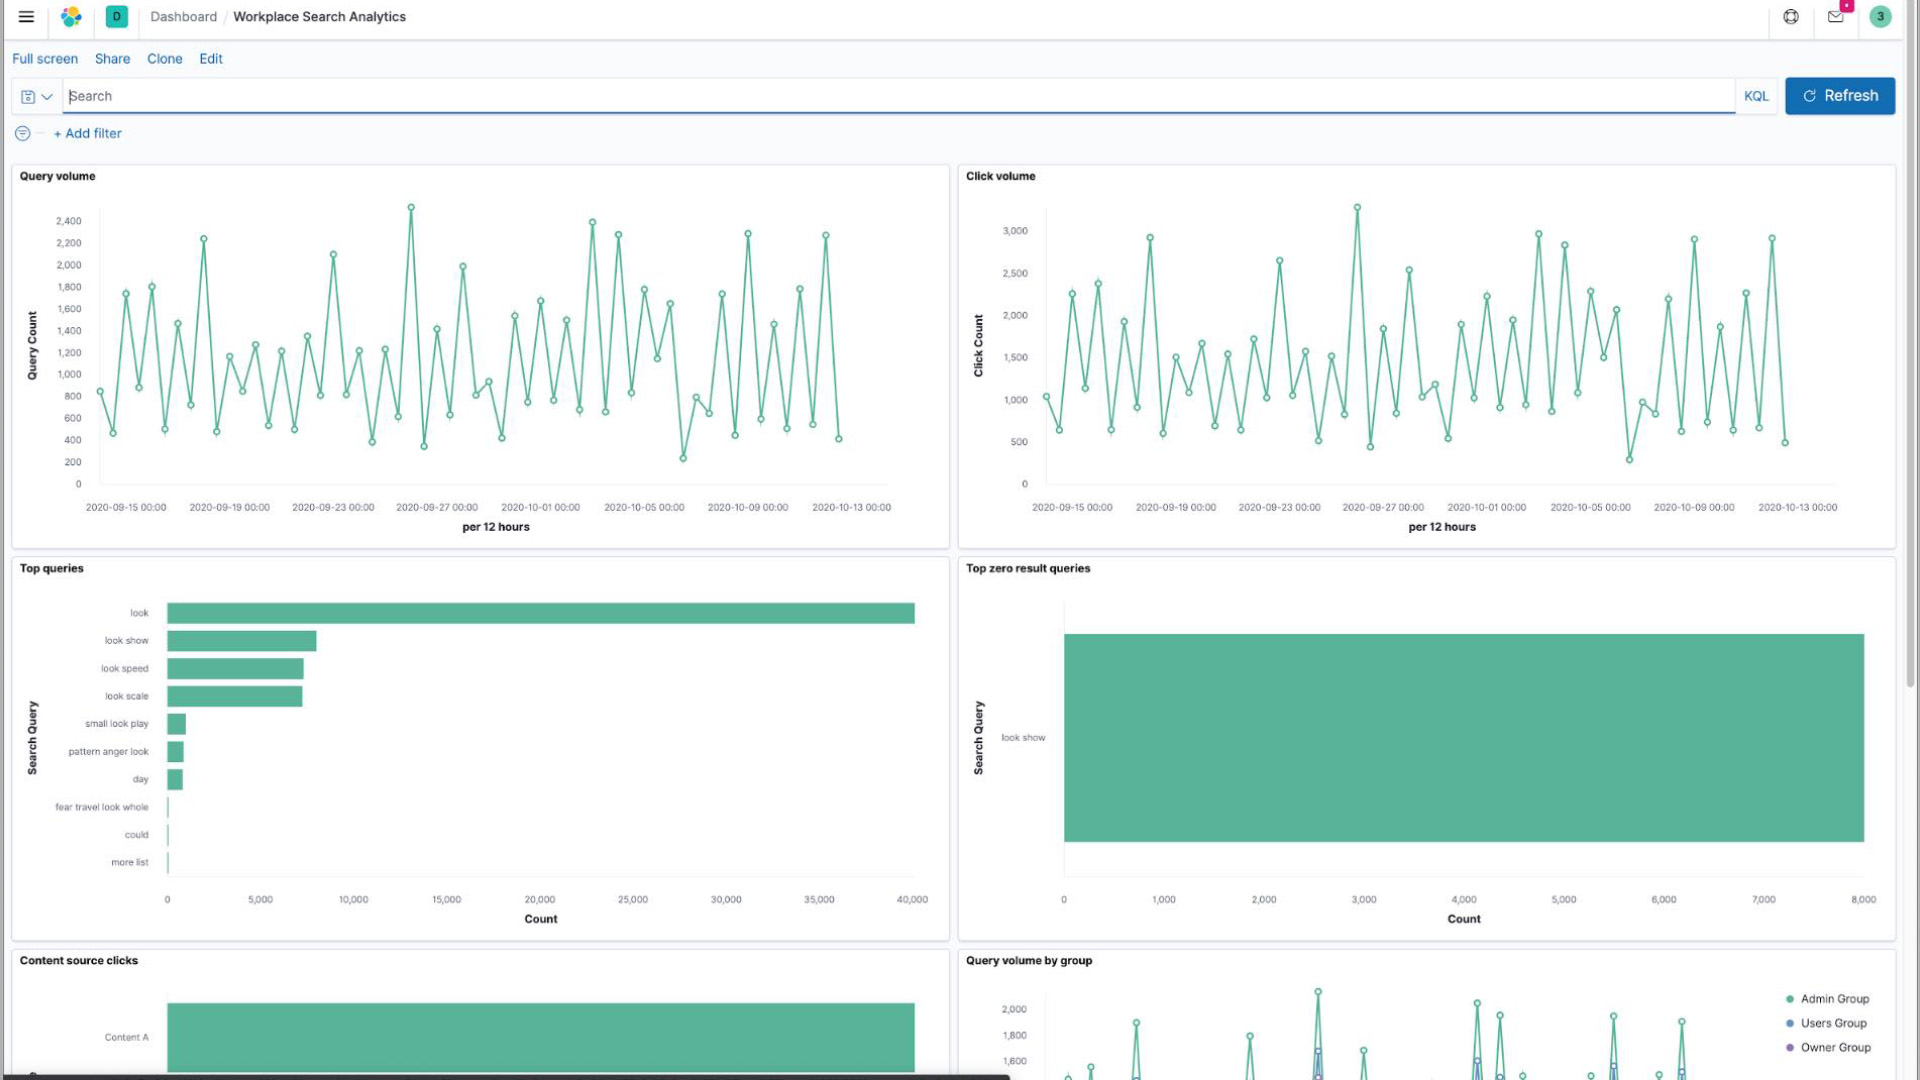
Optimize search experiences for customers and users by analyzing and visualizing website and user behavior data. Spot trends in user queries, improve search result relevance, and more.
- Visualize with Kibana Lens
- Analyze search relevance metrics with dashboards and machine learning
- Improve results with search analytics
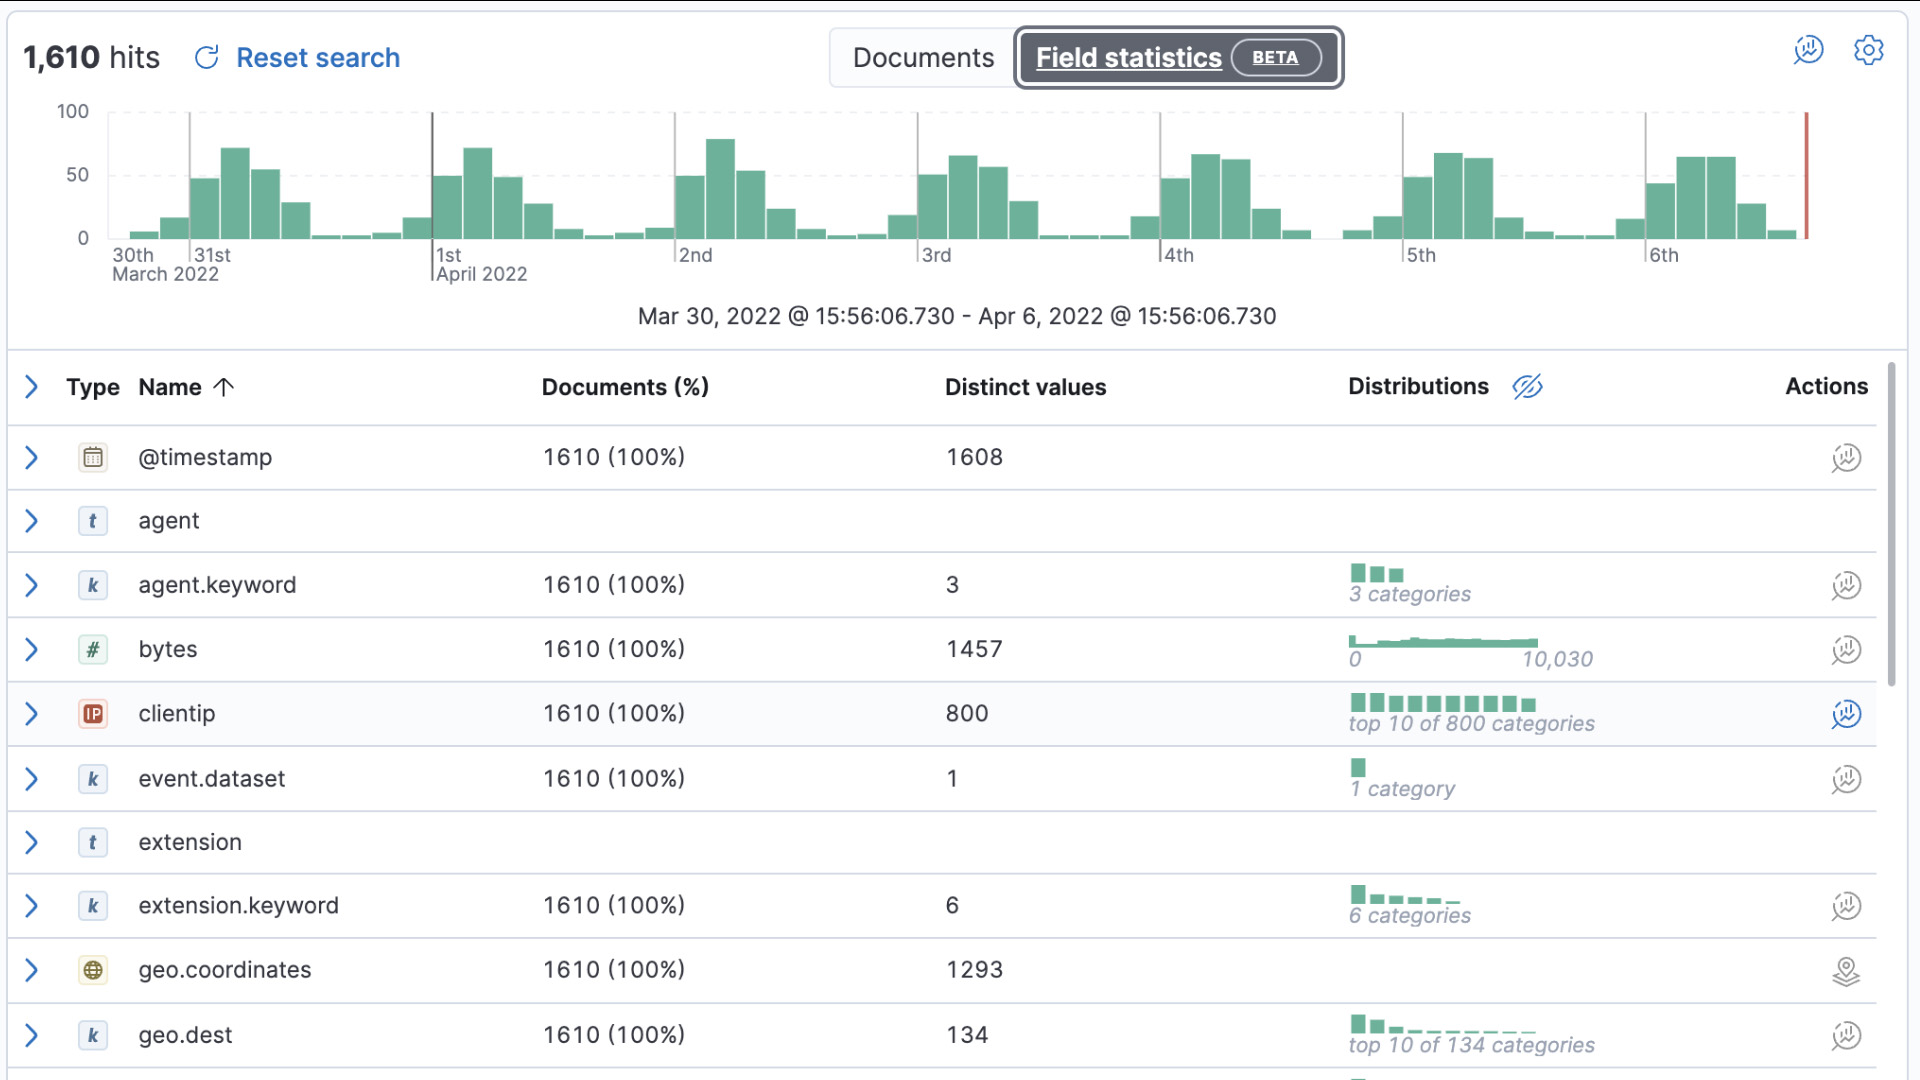
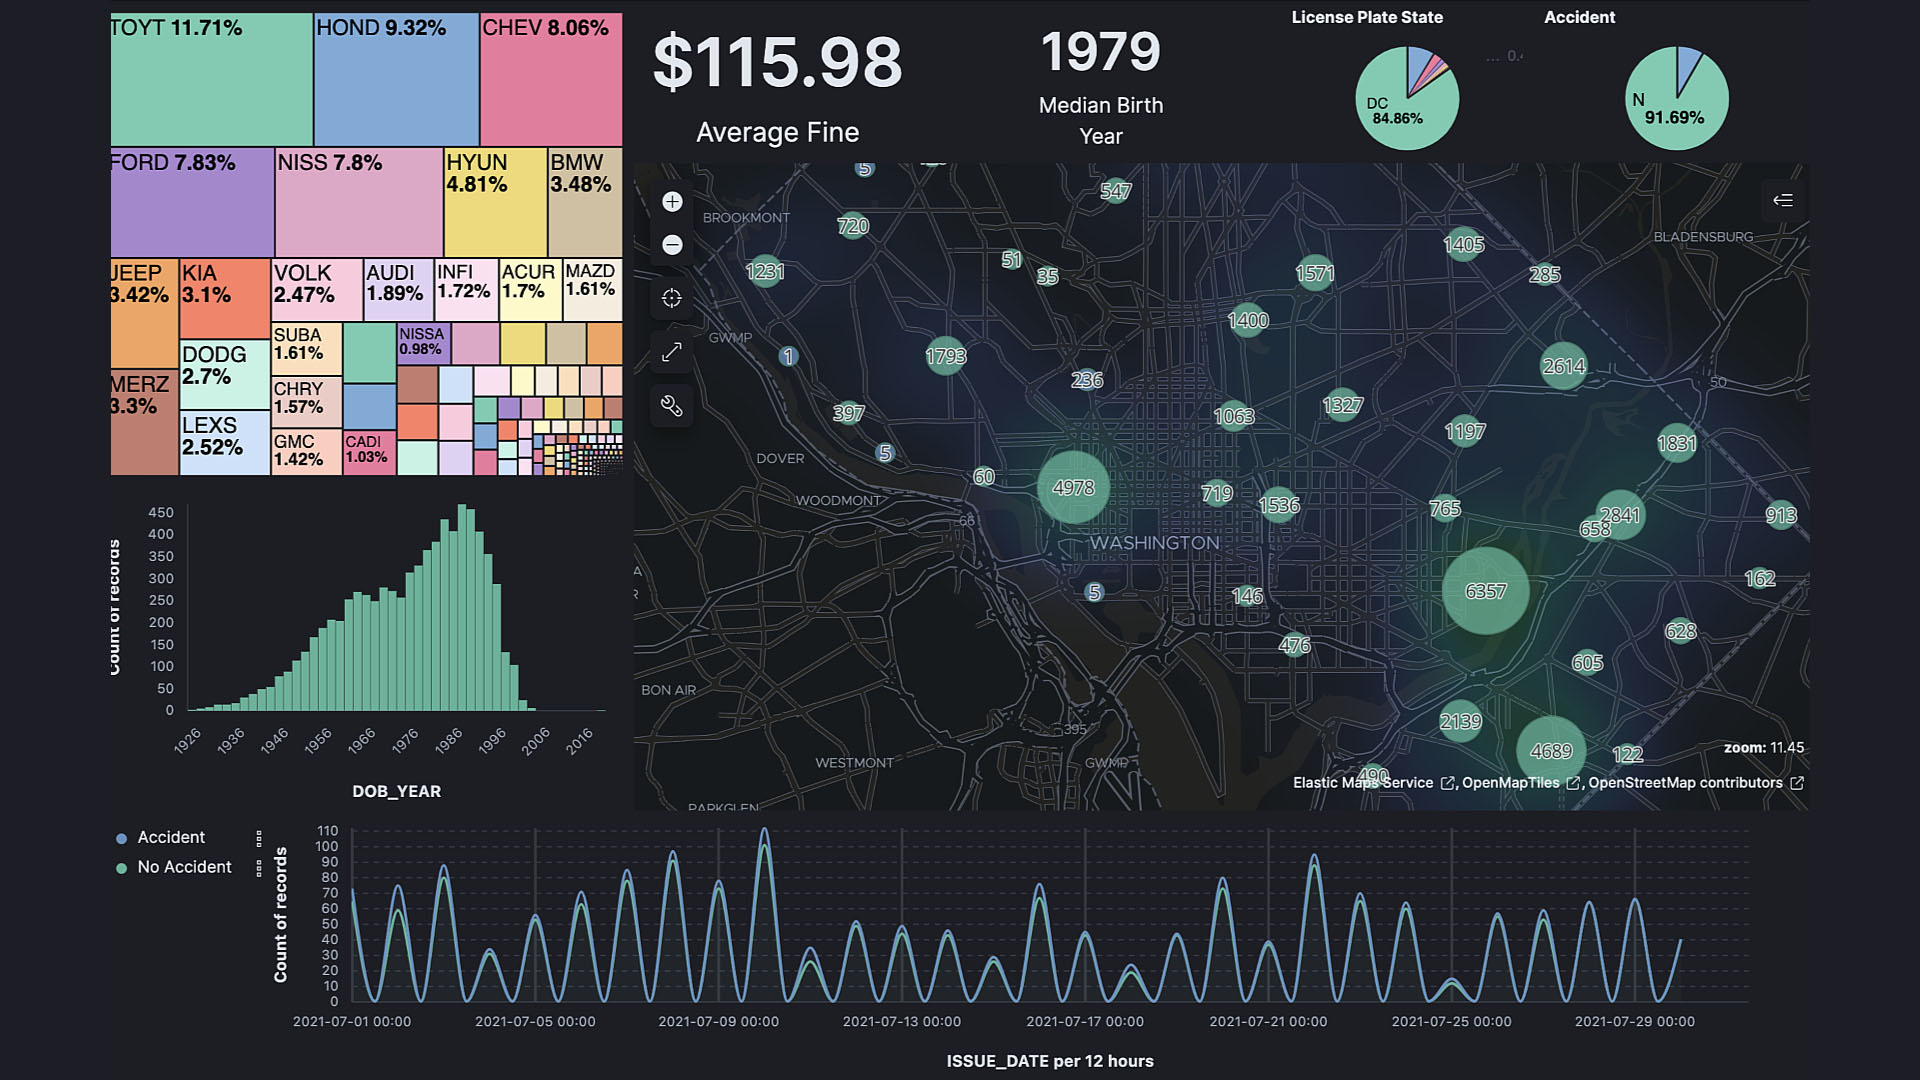
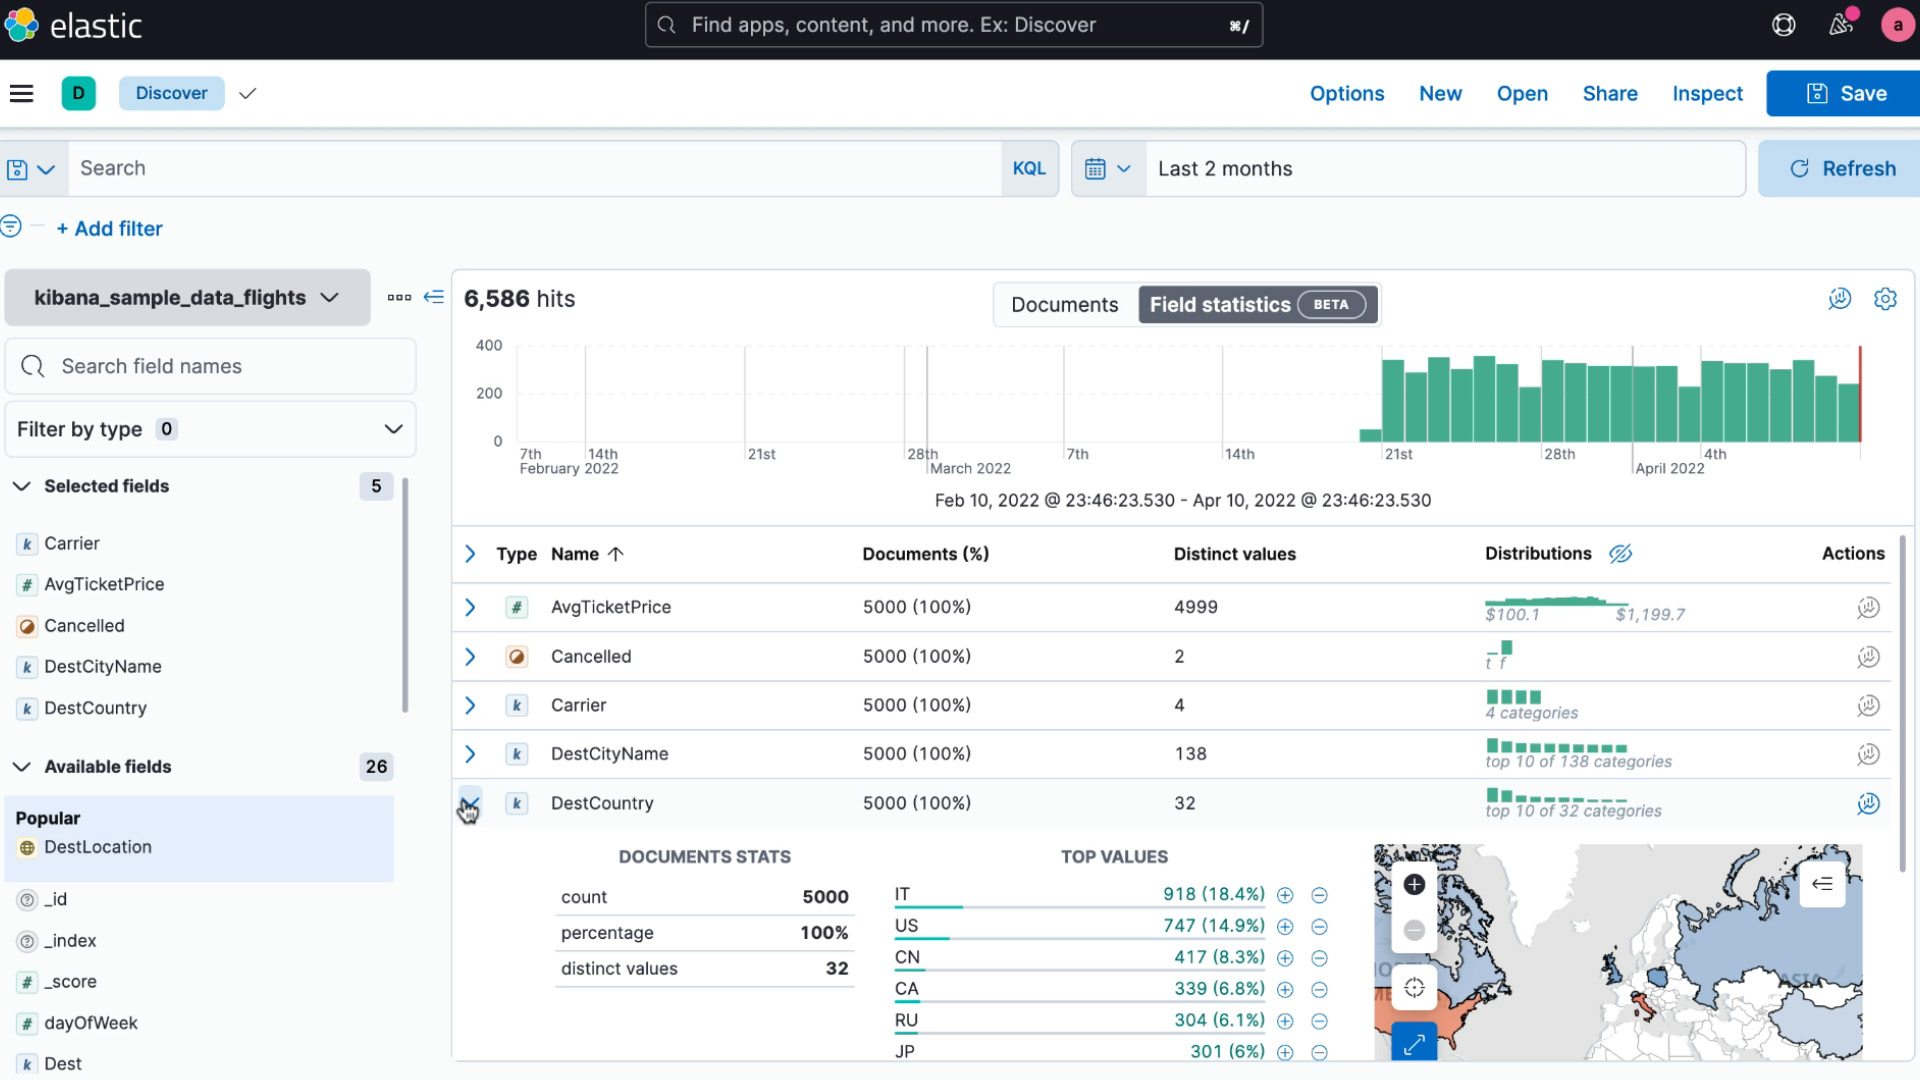
EXPLORE AT SPEED
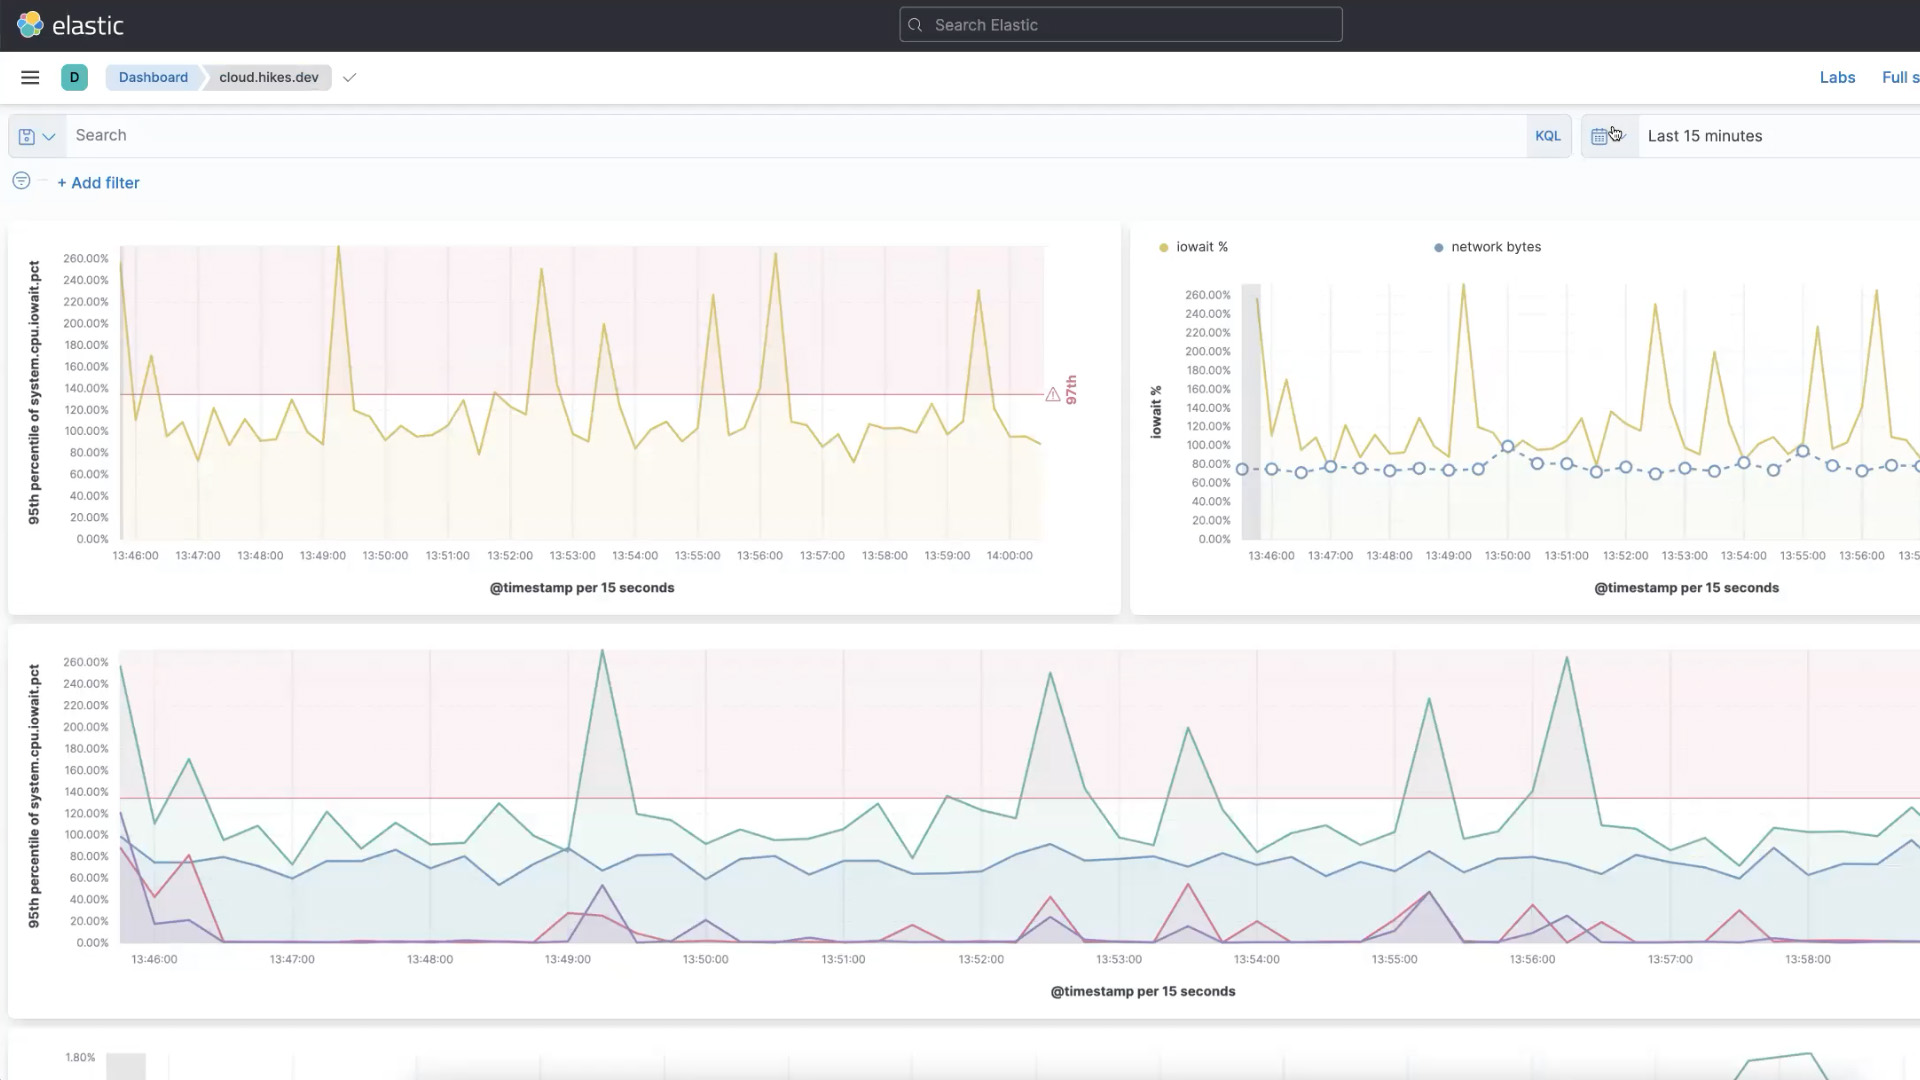
Go from bird's-eye view for strategic data discovery – to worm's-eye view in a few clicks to detect anomalies and troubleshoot issues. See all your fields and data distributions in one place so you can understand your data, transform it if you're missing something, and know the scope of your analysis before you start investigating.
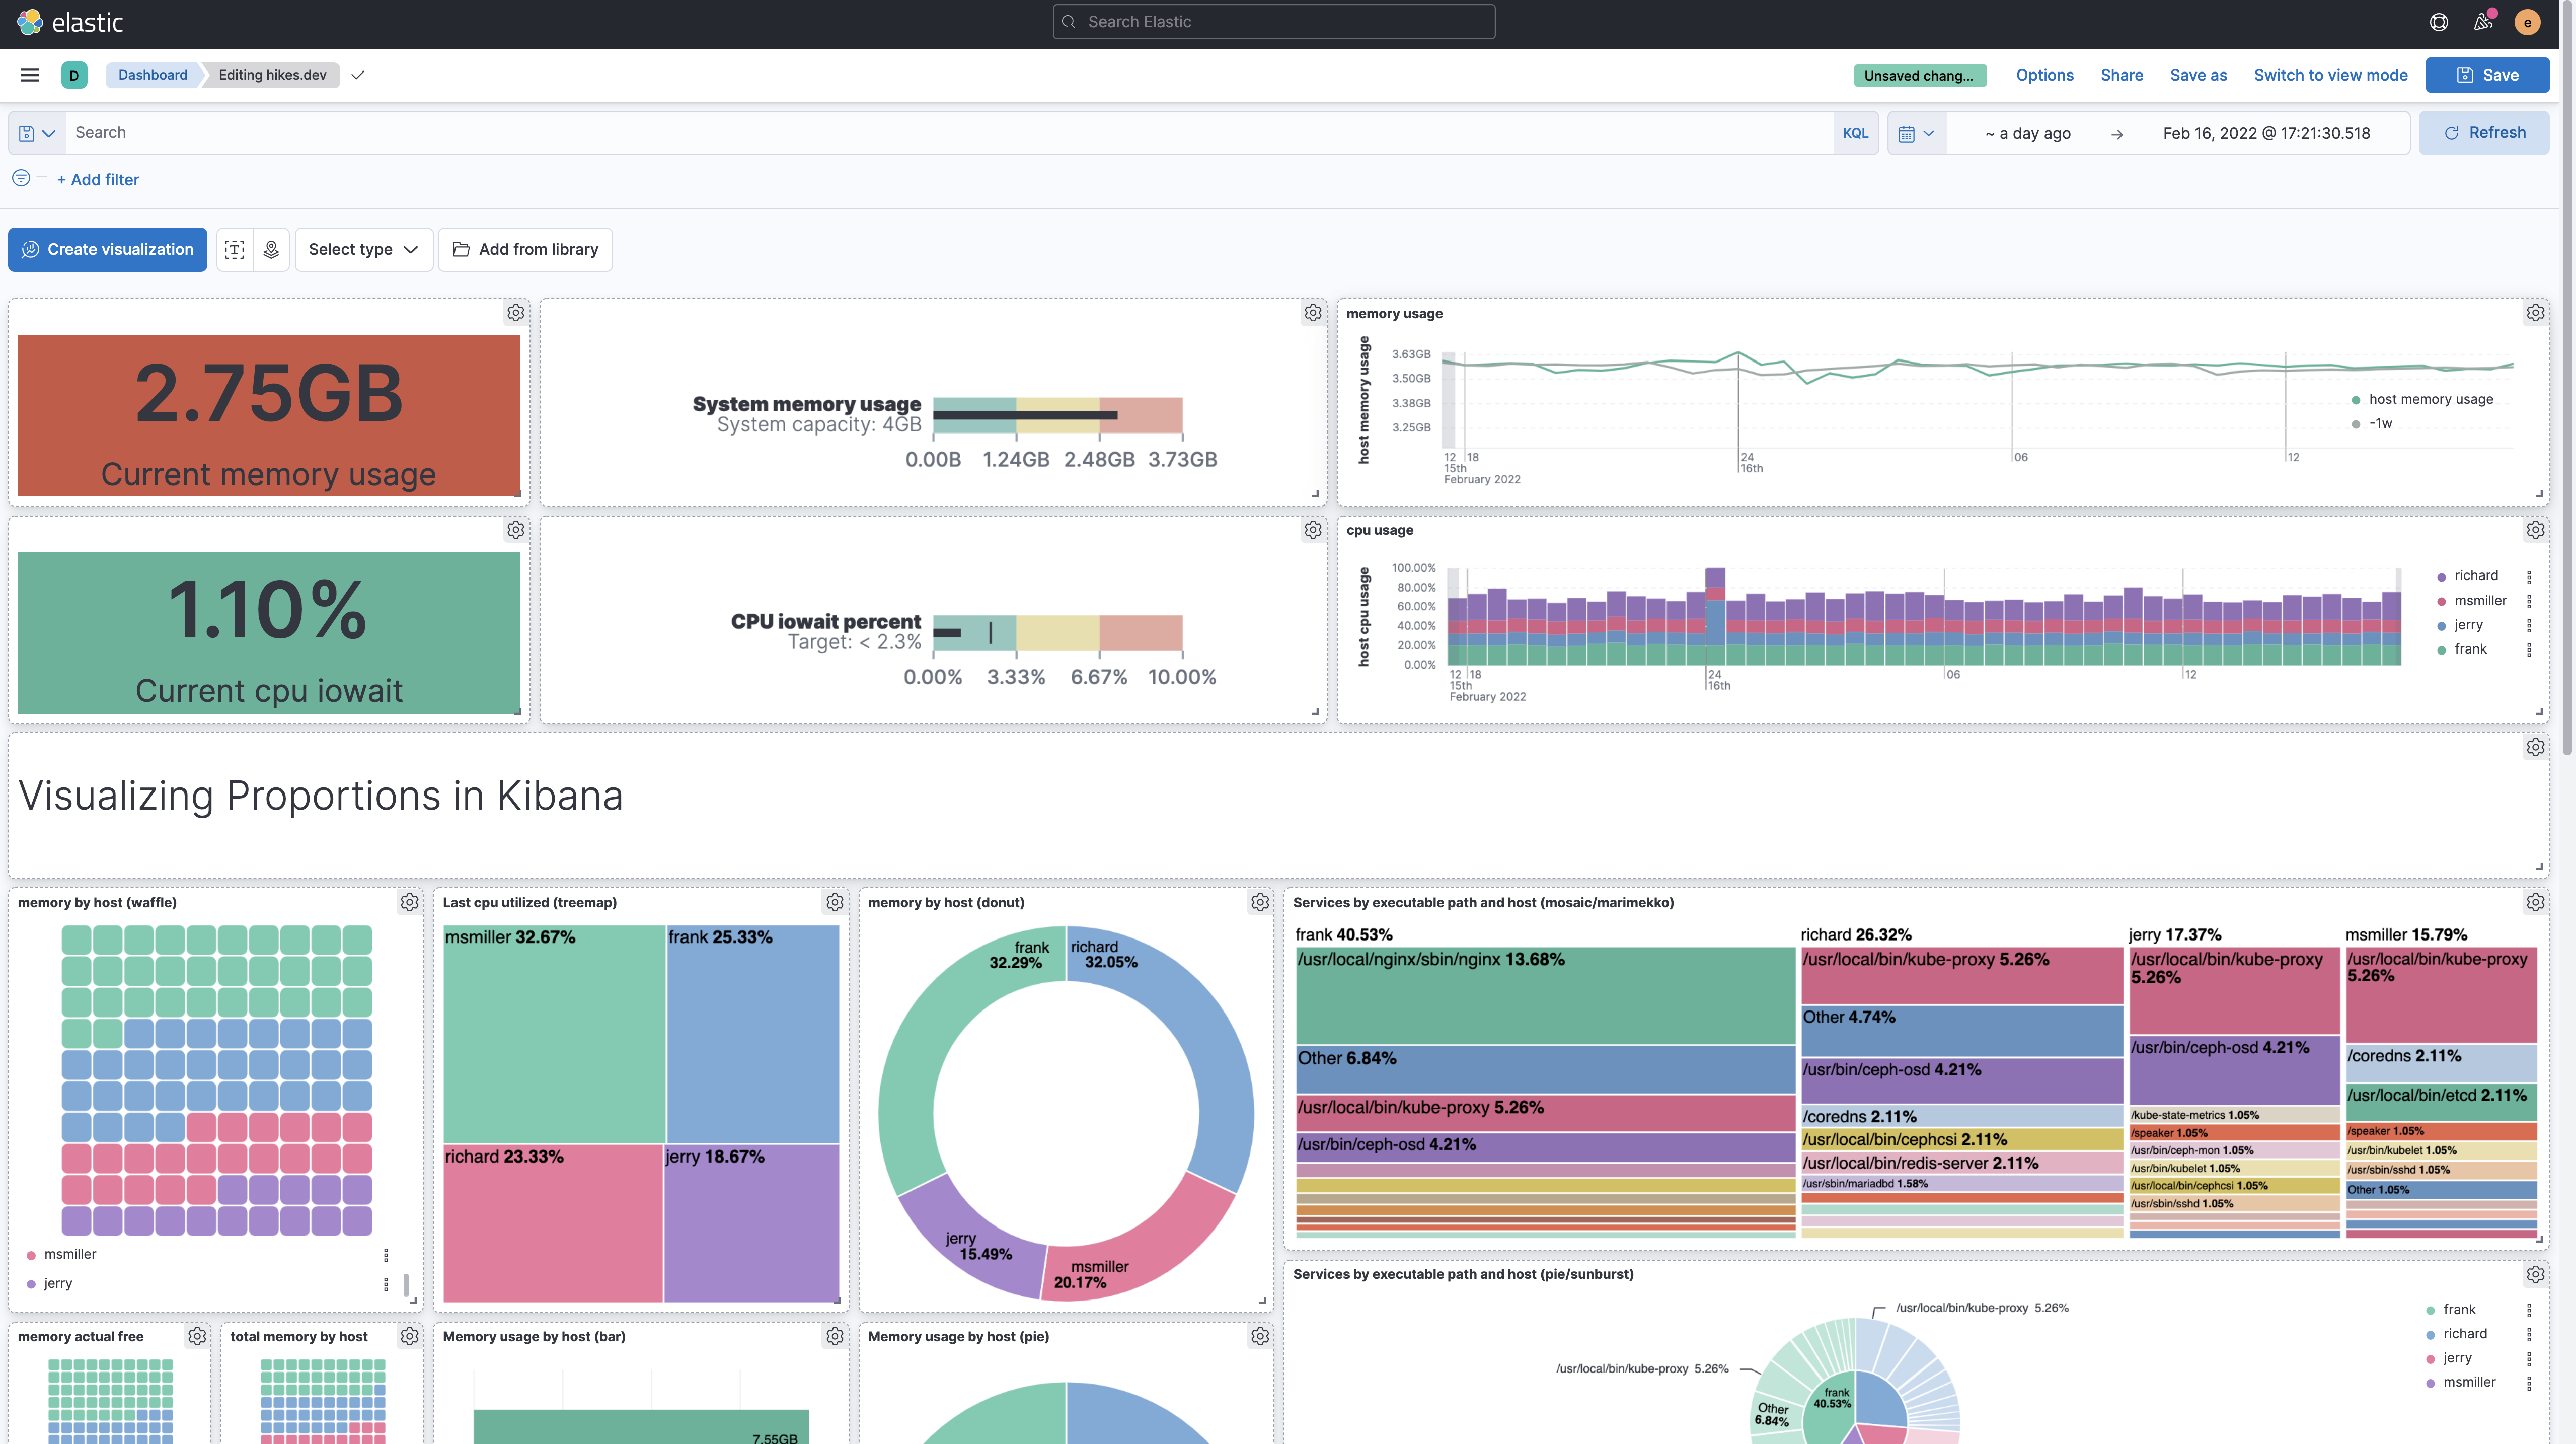
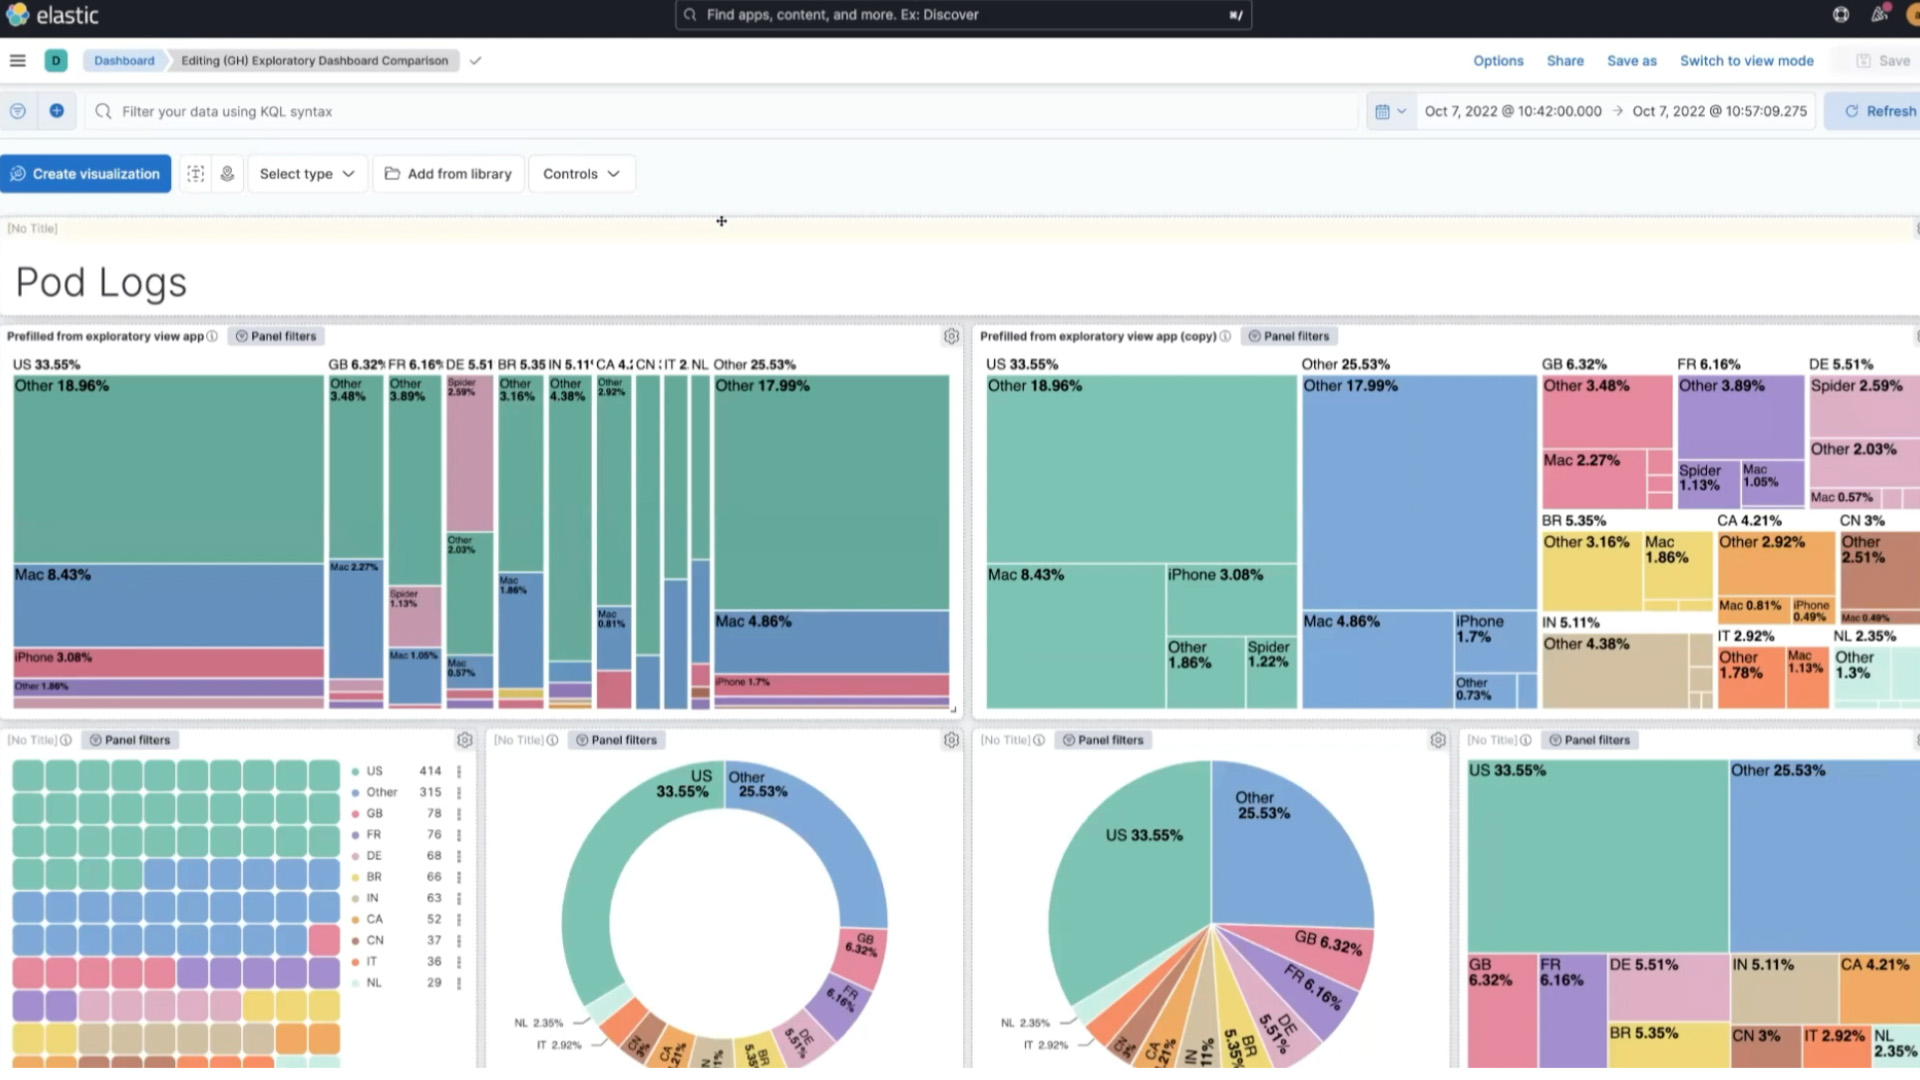
SHARE AT SPEED
Rapidly create dashboards that pull together charts, maps, and filters to display the full picture of your data. Build customized dashboard-to-dashboard drilldowns that enable deeper analysis. Create cases for investigations and invite teammates to collaborate, making it easier to move from insight to action.
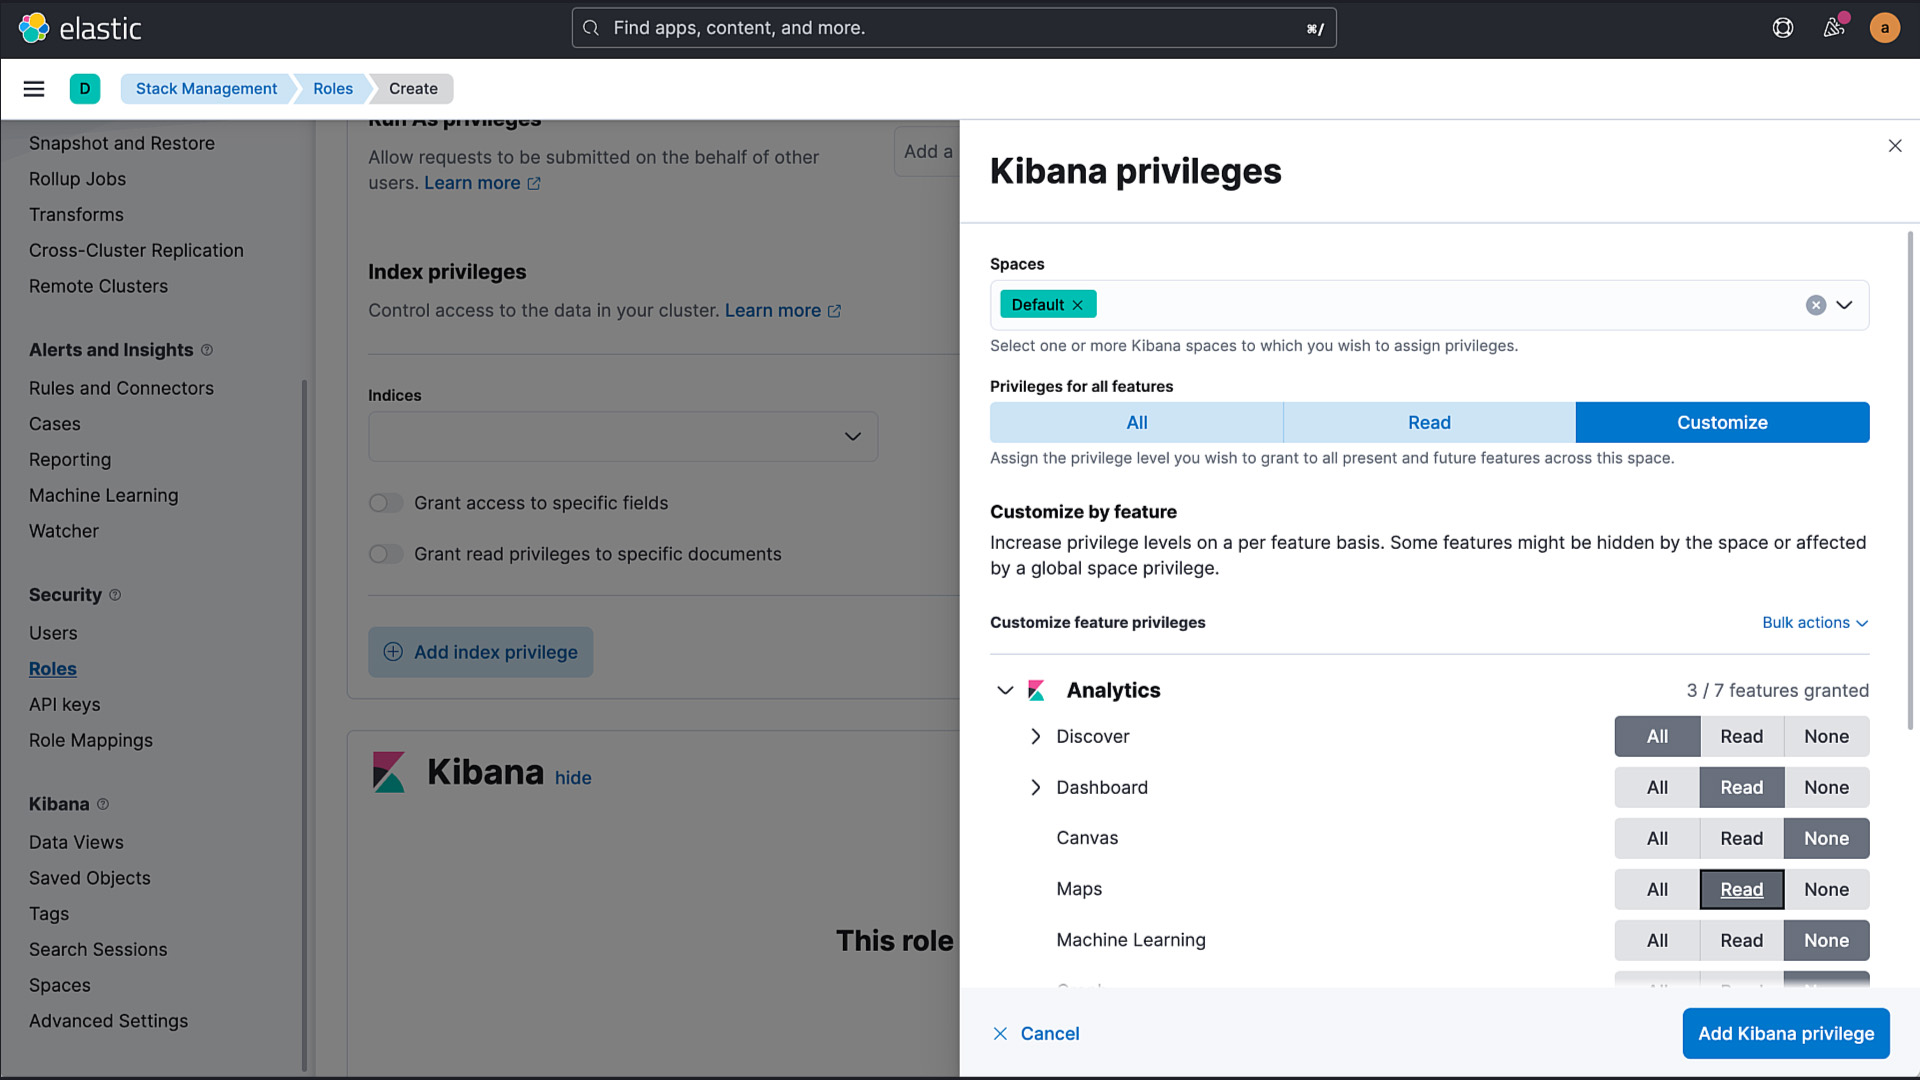
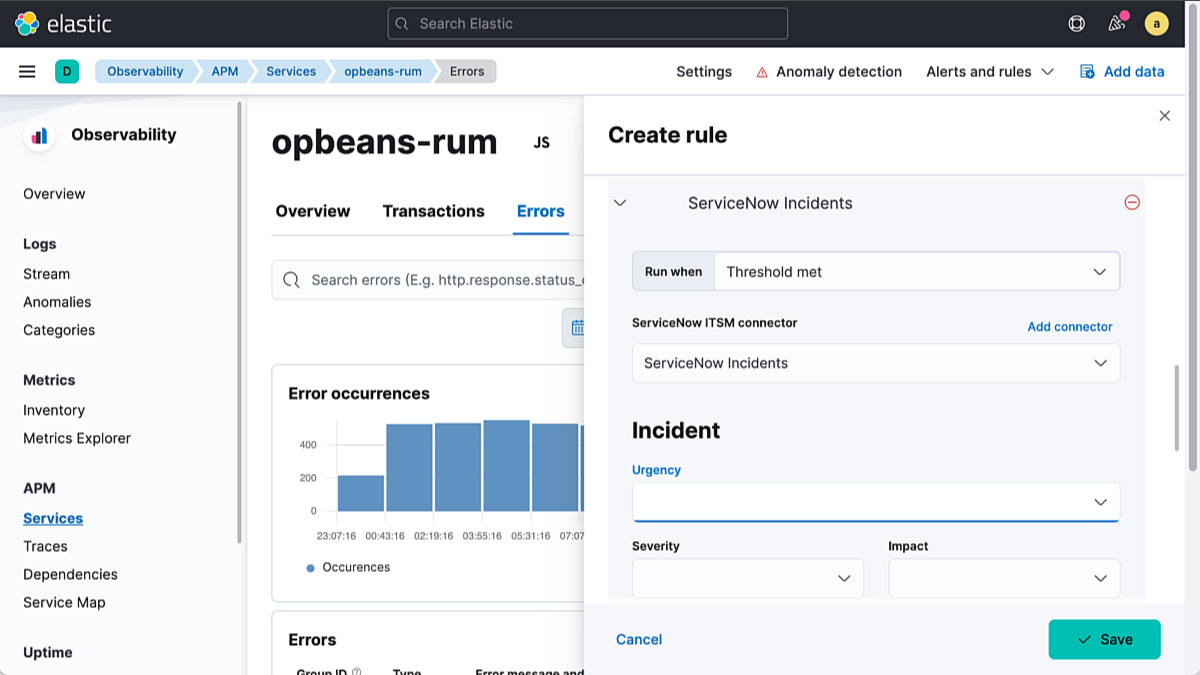
NOTIFY AT SPEED
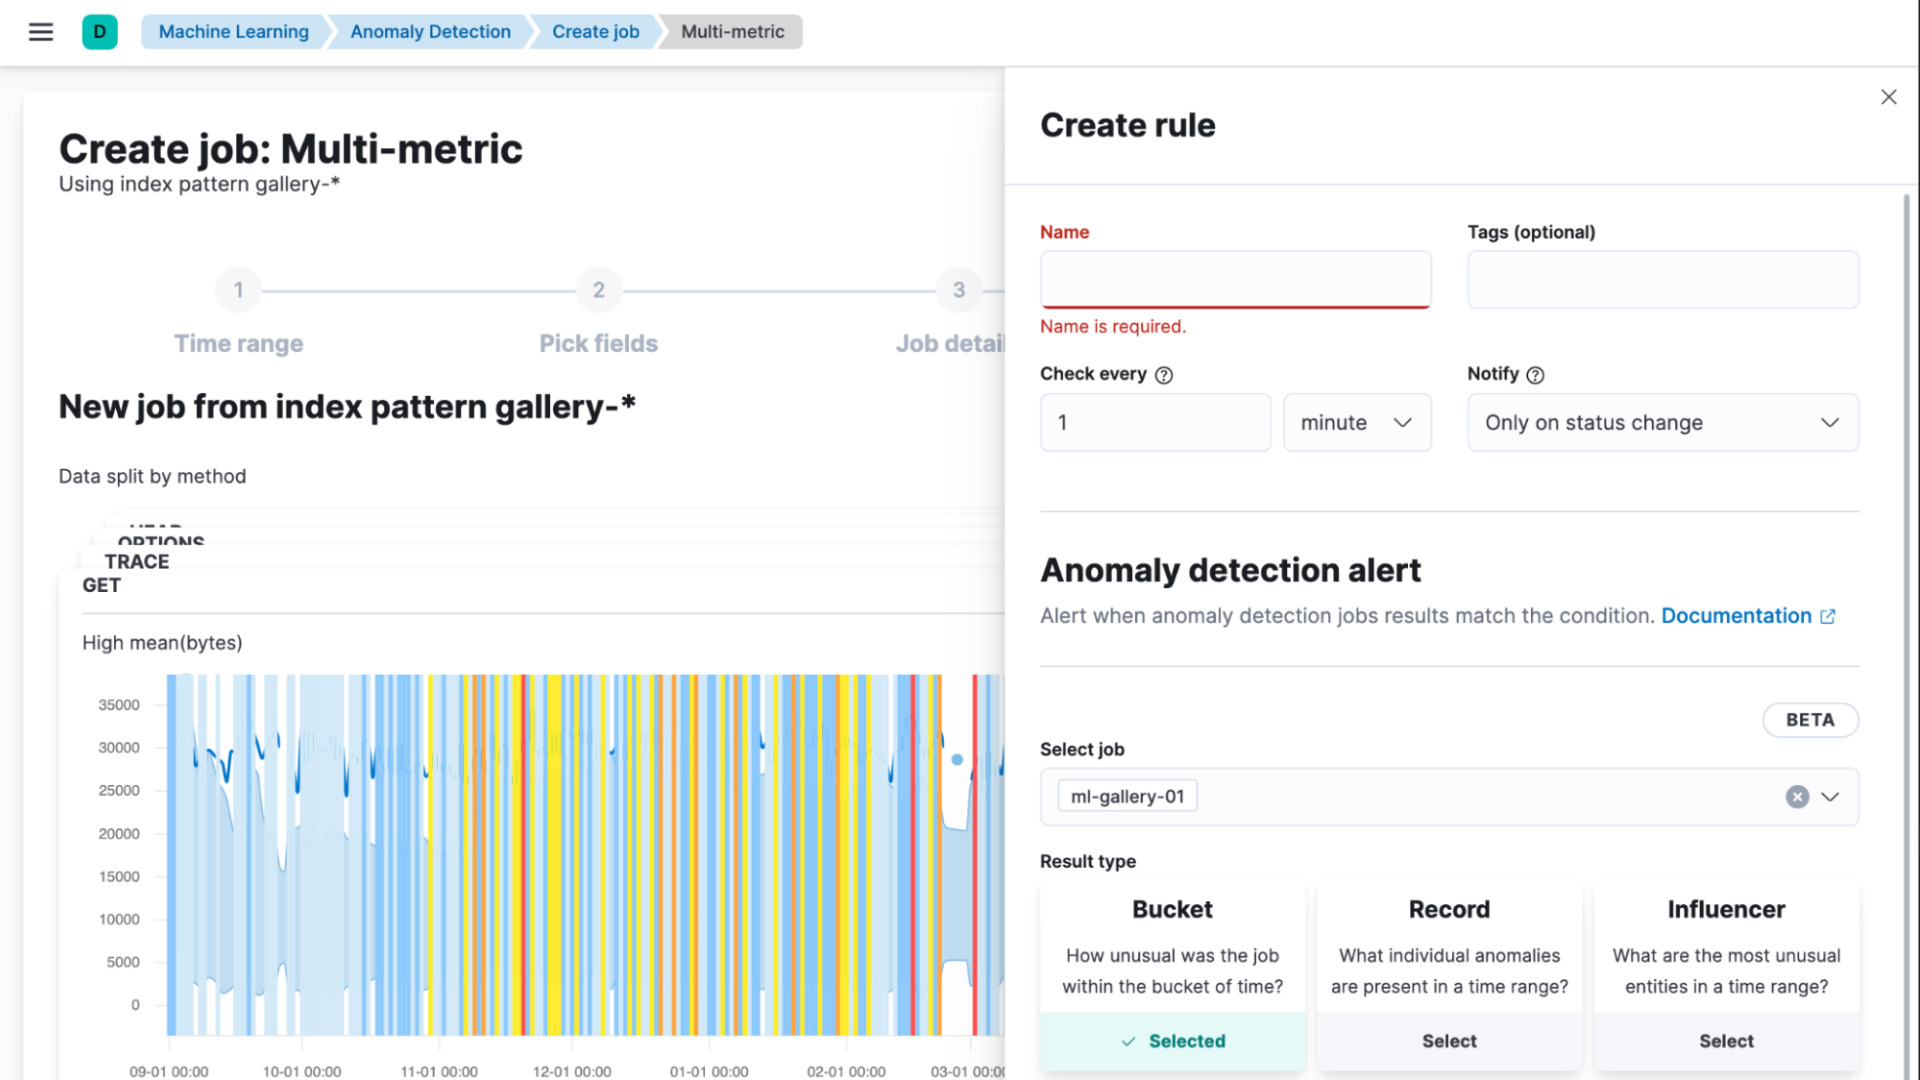
Keep critical changes on your radar to avoid crisis scenarios. Create alerts that use index- and metric-based thresholds to send emails, create Slack notifications, activate PagerDuty workflows, or any number of other third party integrations. Define unique alerts from within Discover, Elastic Observability, and Elastic Security and monitor them holistically in the Management tab.
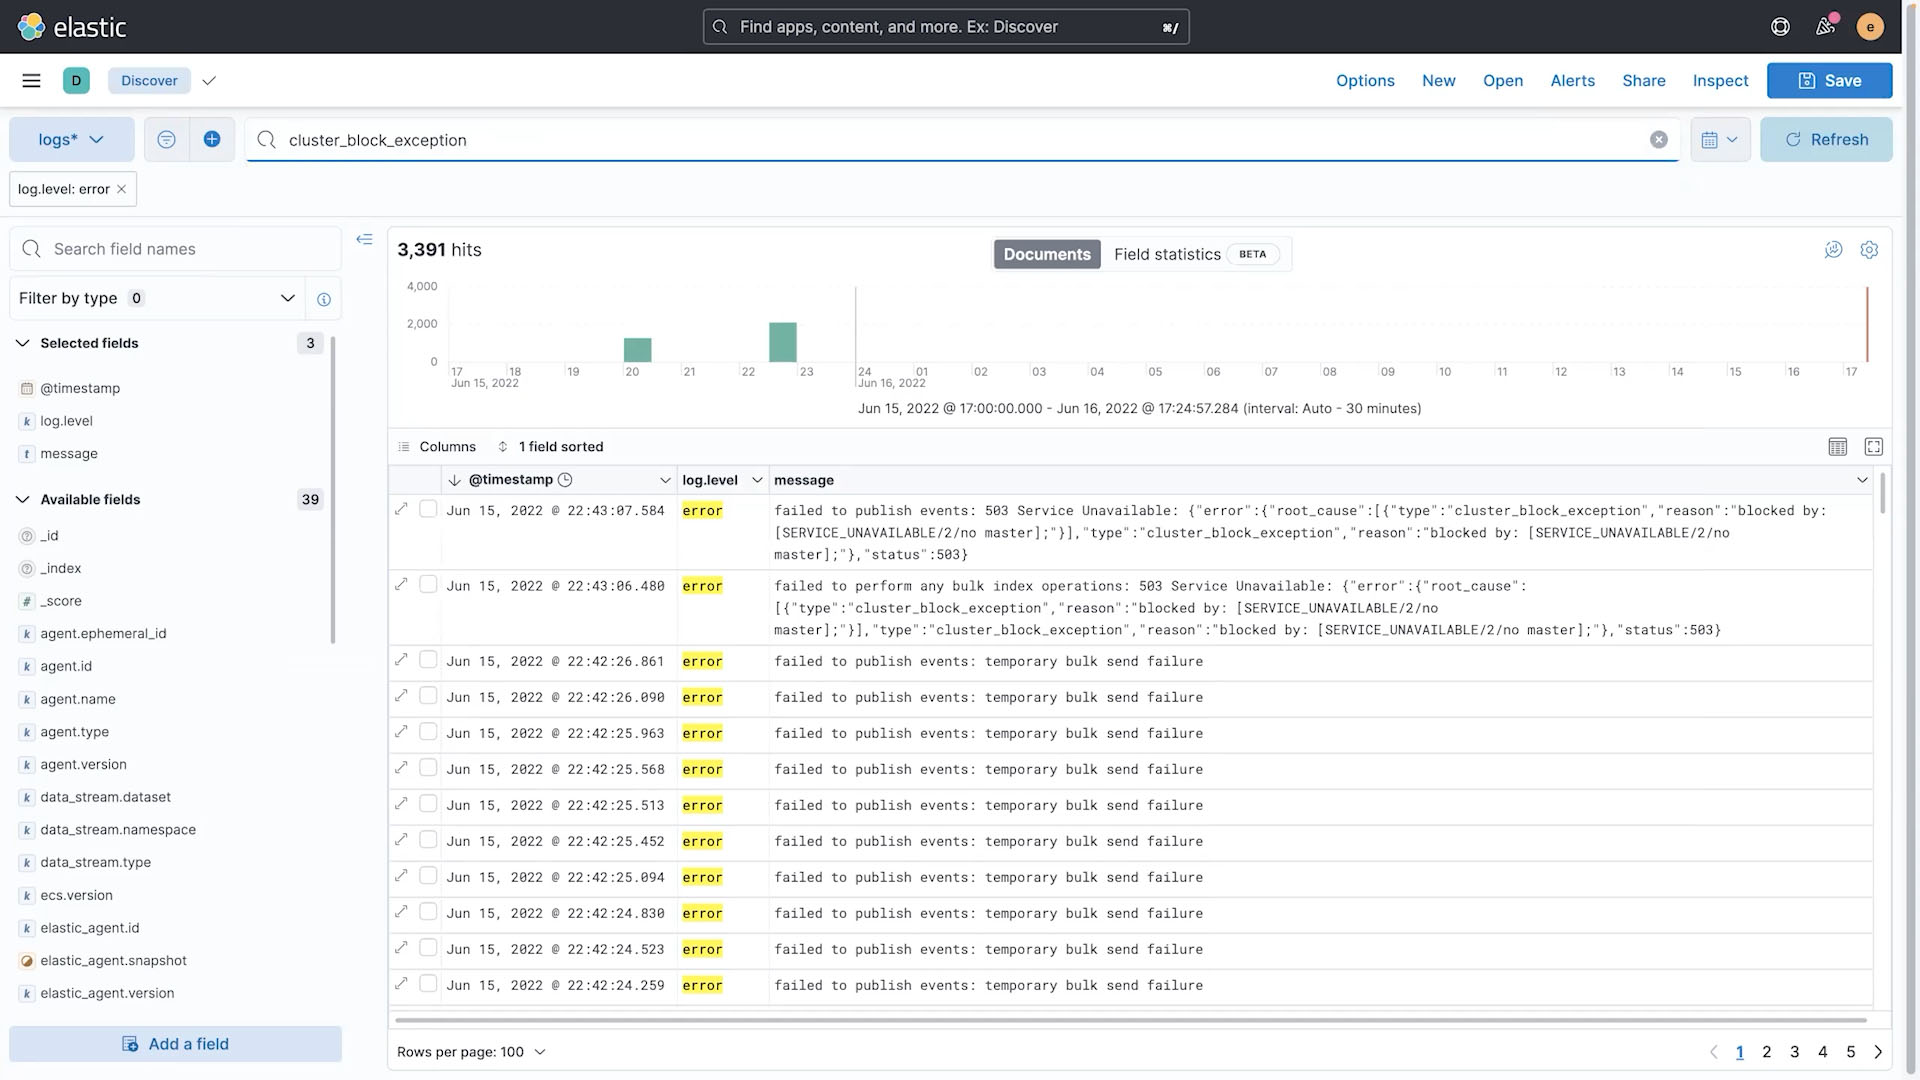
EXPLORE AT SCALE
Move quickly from ingest to analysis with Discover’s data exploration tools. Seeing more of your documents in one place means you can easily find the information you need, and slice and dice your data – however you please.
Prepare results and findings for your leadership team with presentation-ready data visuals. Infuse your brand and style into the story of your data with the logos, colors, and design elements that are unique to you. Canvas helps you get creative with your live data — and it supports SQL.
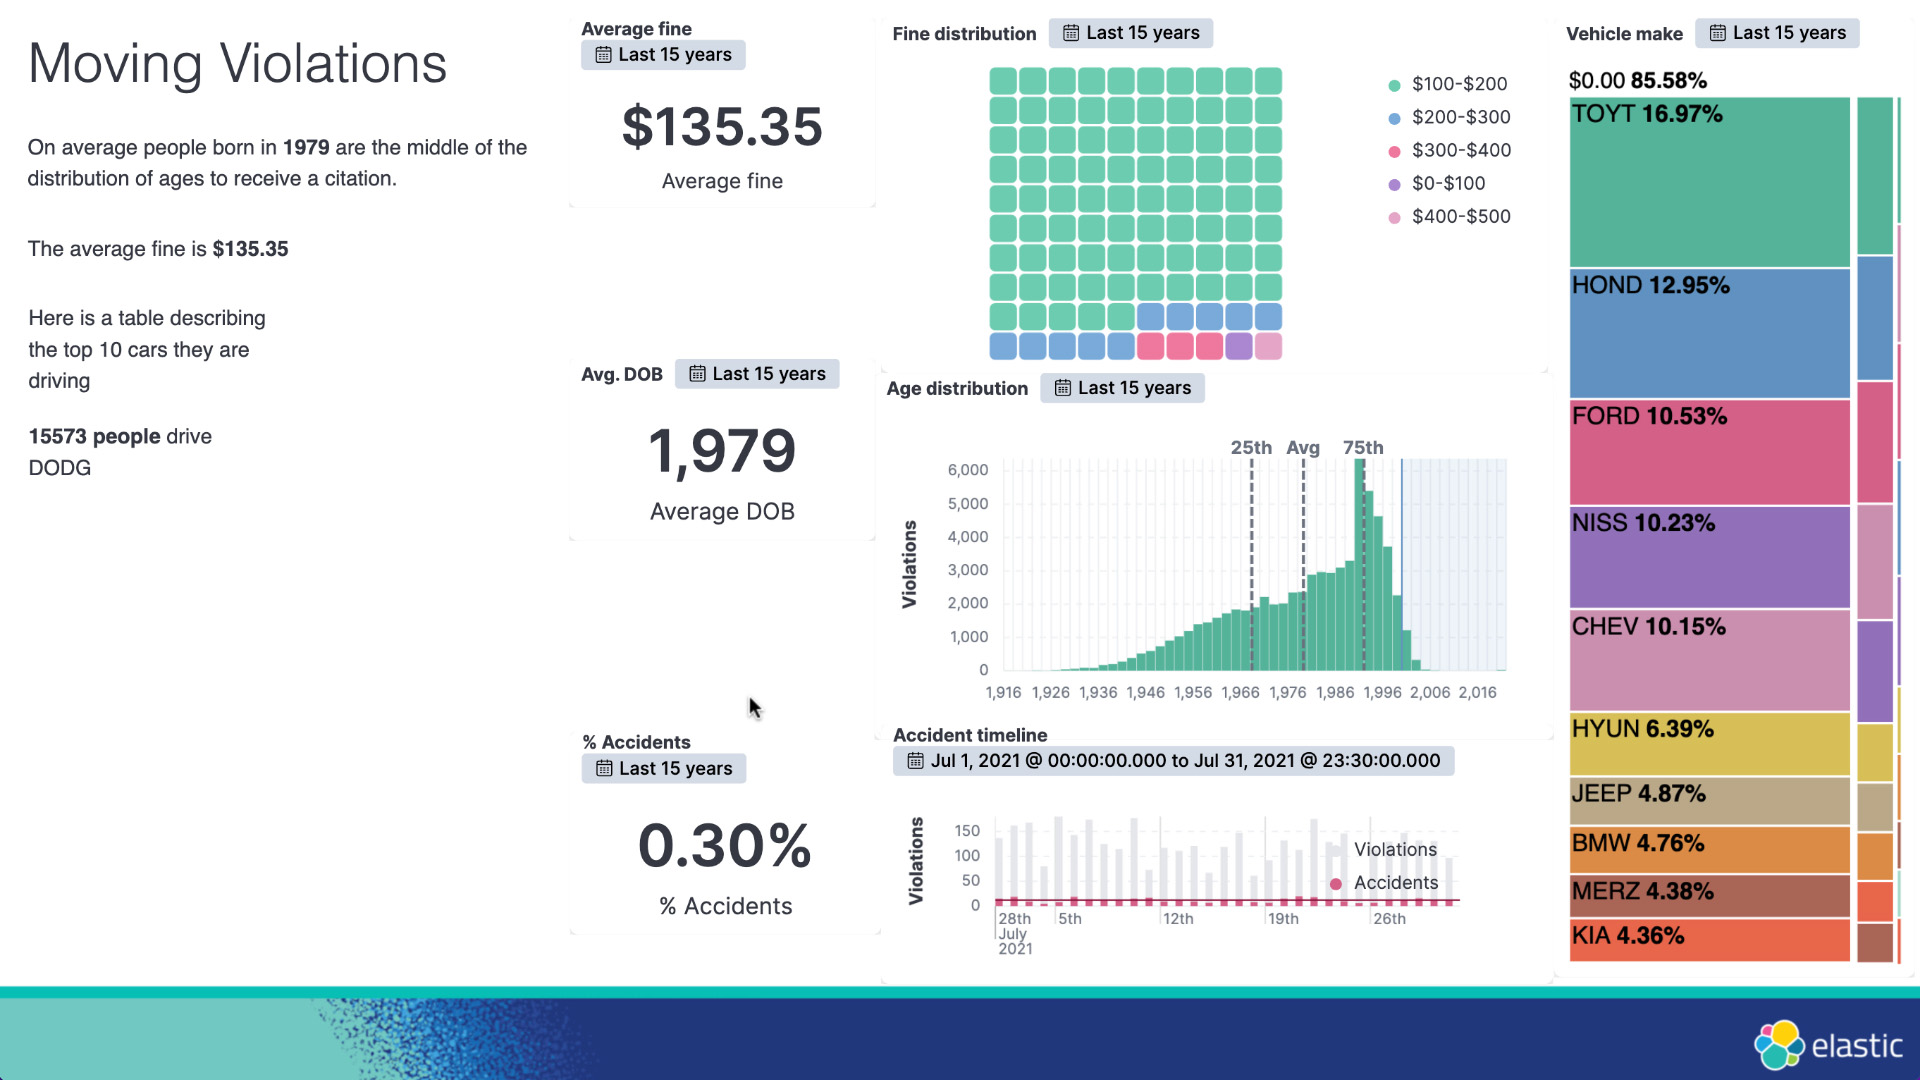
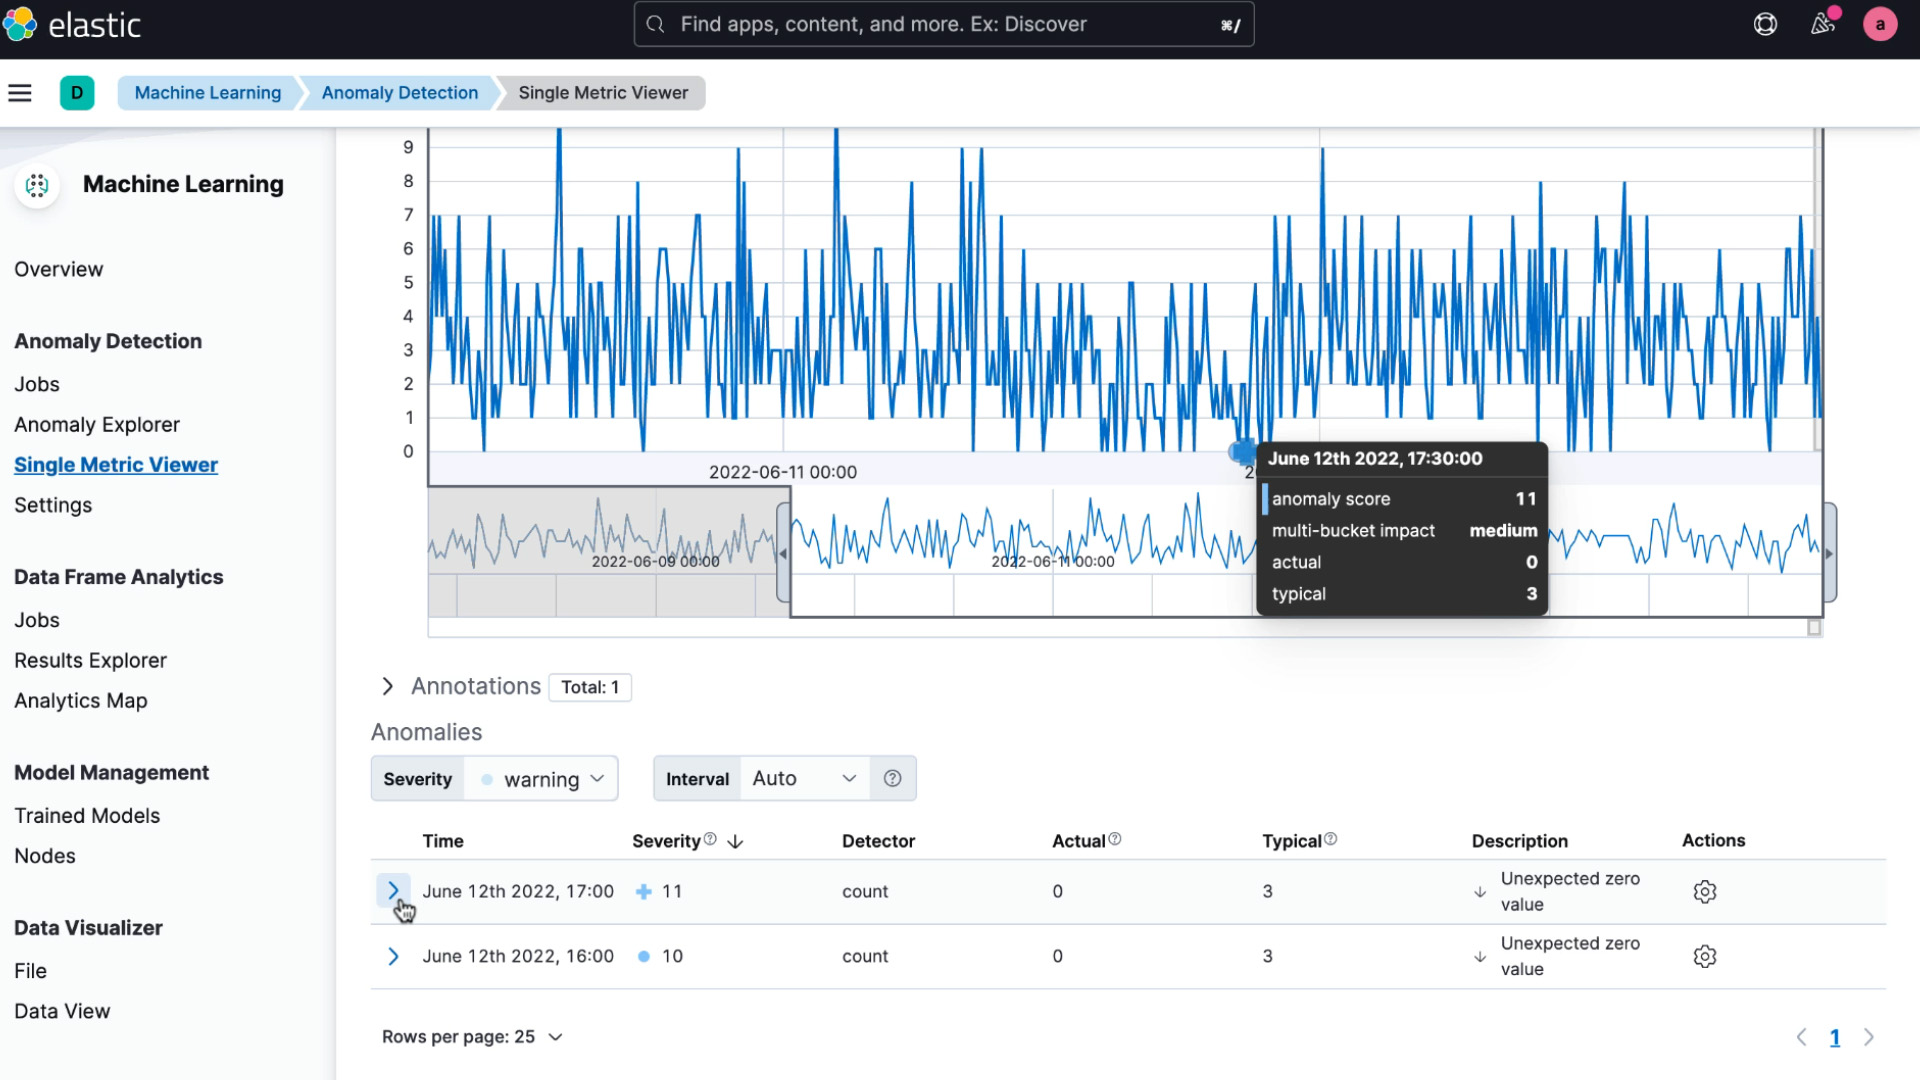
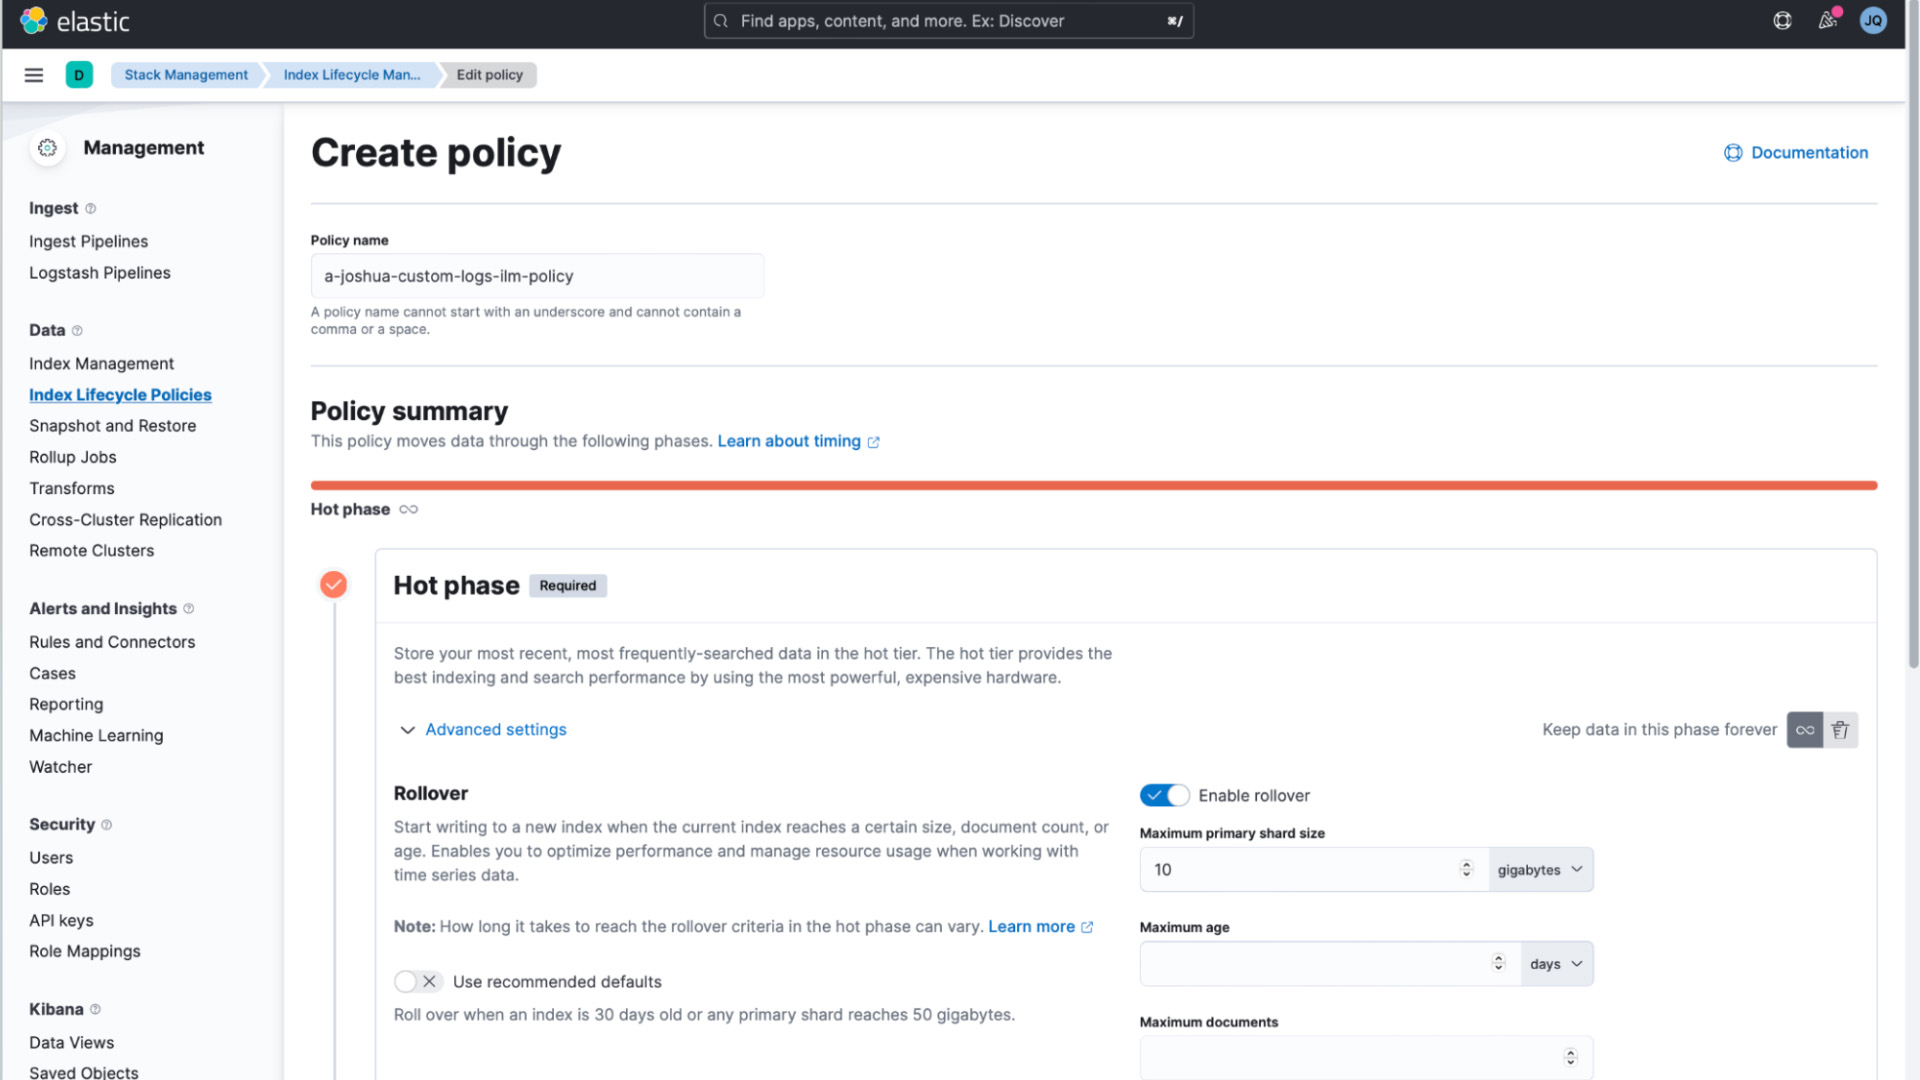
Replay your data in time and space to gain historical context and understand additional insight about the present. Use analytical power tools to spot anomalies and forecast future scenarios. Store all your historical data with searchable snapshots and data tiers and easily search archival data for use cases that require years of data.
Use Elastic's machine learning to automatically detect anomalies in your data, classify into categories, or identify trends that lead you to root causes. After visualizing data with Kibana Lens, you can transition straight into configuring the appropriate machine learning from your dashboard.
Instead of learning to use and managing disparate tools for different data sets and use cases, why not collect, store, search, and analyze data all on one data analytics platform? Use Kibana for managing your team’s access rights, sharing insights within and outside of your organization, and connecting with other systems.


Elastic dashboards help our technical account managers deliver a better customer experience. Instead of coming to us with questions about the status of an incident or failure rates, they can see the information at-a-glance and take action to resolve customer issues more quickly.
Trusted, used, and loved by