


Rely on the most widely deployed observability solution, built on the proven ELK Stack, to converge metrics, logs, traces, and profiling data for unified visibility and actionable AI-powered insights.
Learn why Elastic was named a Visionary in the 2022 Gartner Magic Quadrant for Application Performance Monitoring.
Learn moreDiscover key requirements you should keep in mind when choosing an observability solution.
Download the ebookElastic Observability earns EMA's Top 3 award for Automatic End-to-End Observability. Read the report to find out how it increases developer productivity.
Learn moreThe Elastic observability solution
To effectively monitor and gain insights across your cloud-native and distributed systems, you need to aggregate all your observability data in one solution. Break down silos by bringing together application, infrastructure, and user telemetry data for end-to-end observability on a single AI-powered platform.
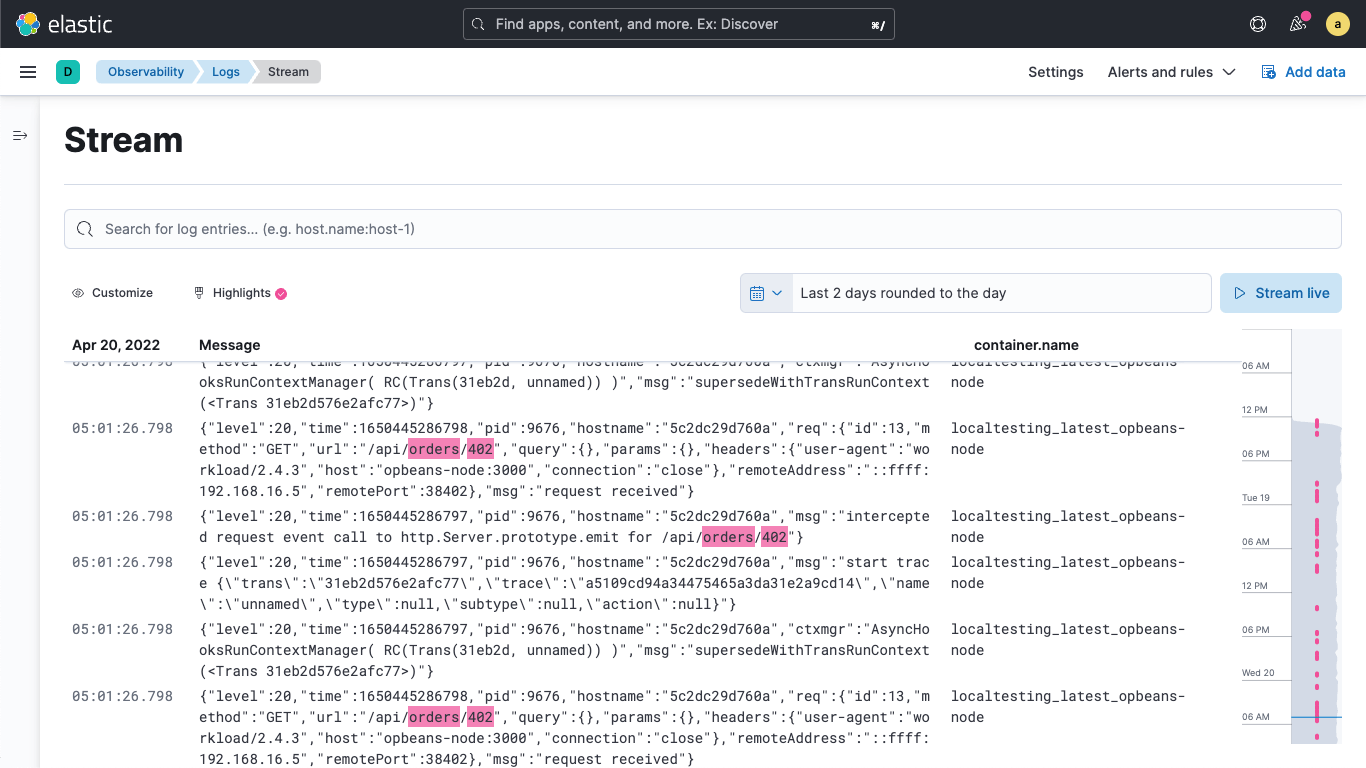
Centralize and search through petabytes of logs, easily
The Elastic observability difference
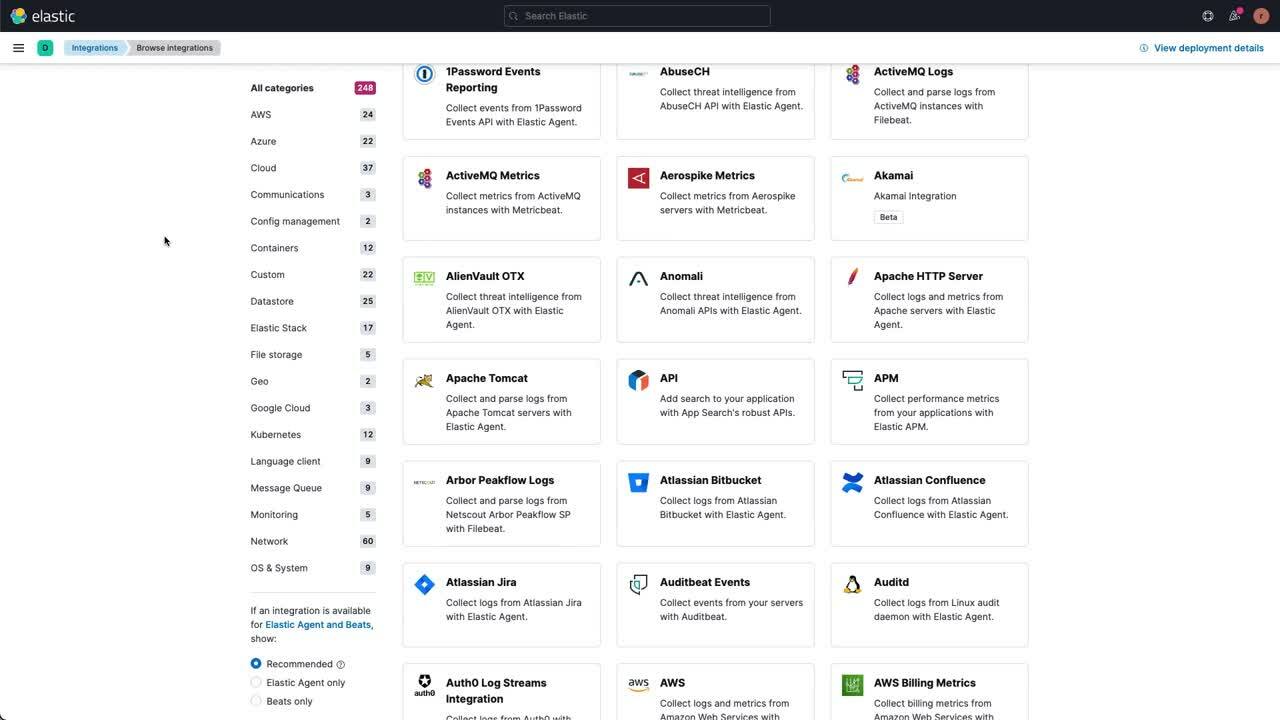
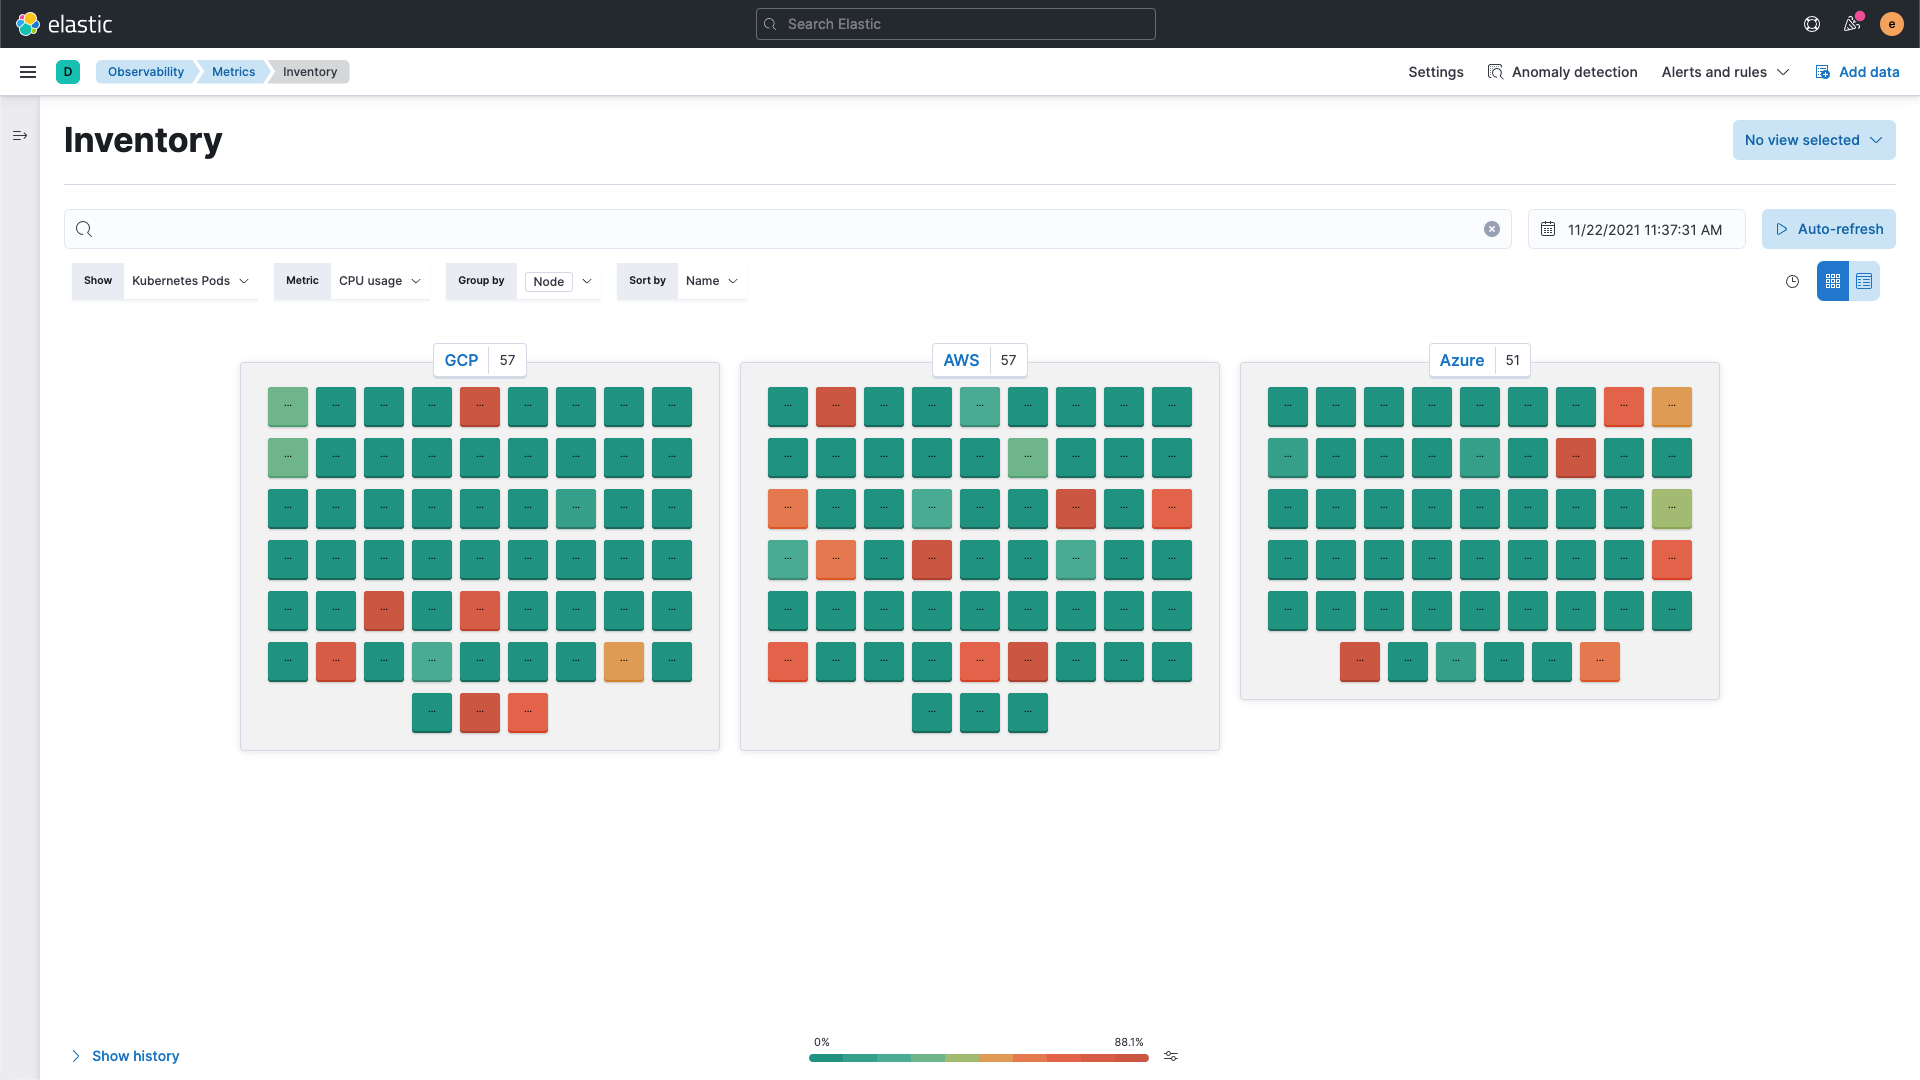
As more workloads move to the cloud, Elastic Observability ensures you have visibility into the most complex hybrid and multi-cloud environments. Ingest metrics, logs, and traces quickly and easily from applications and infrastructure hosted in a data center or on cloud providers such as AWS, Microsoft Azure, and Google Cloud to unify and visualize all data in one place for successful cloud migration and app modernization.
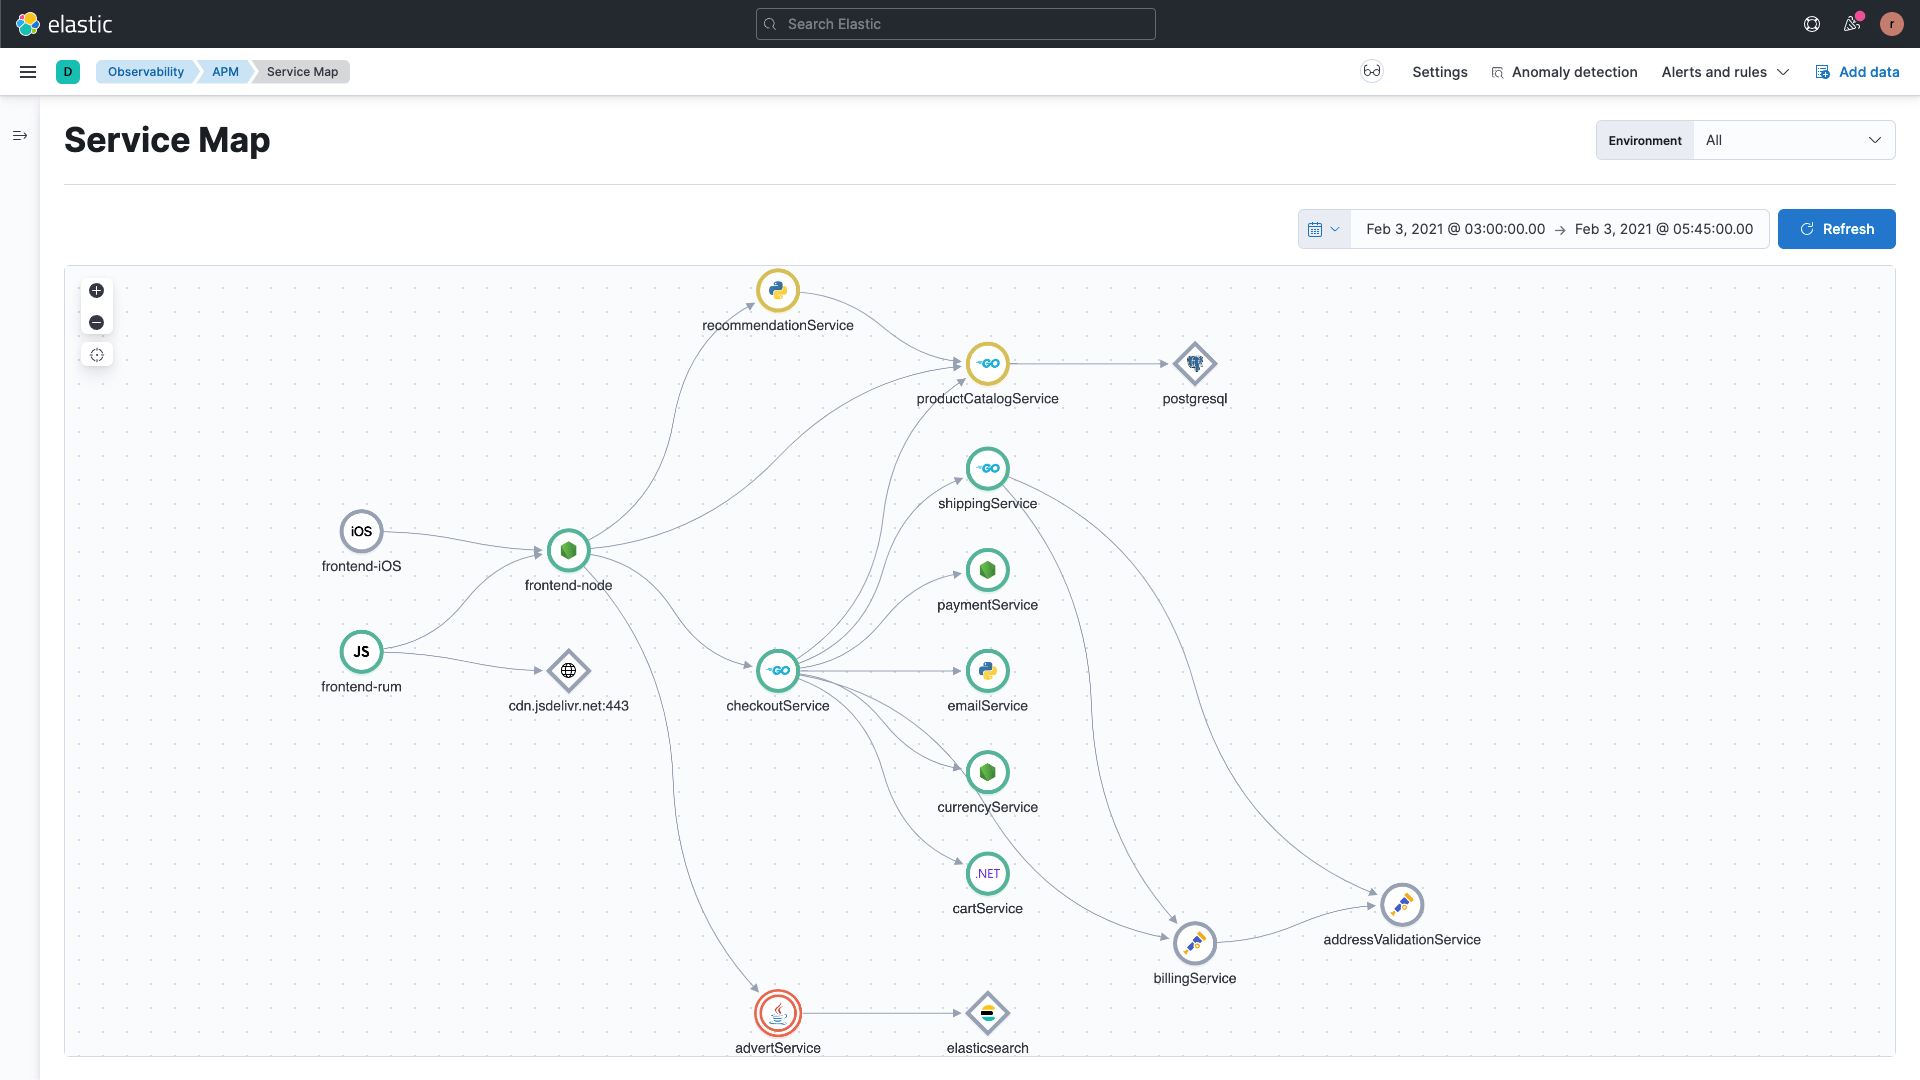
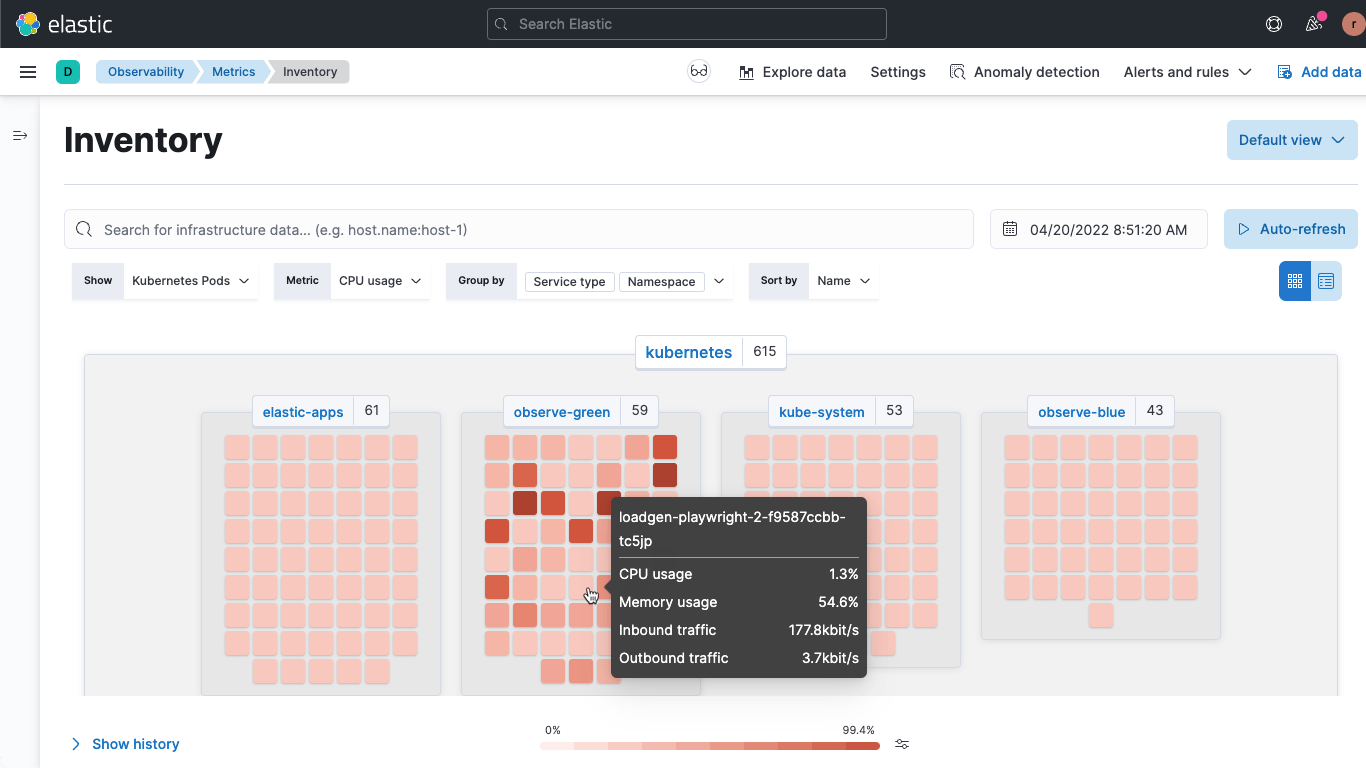
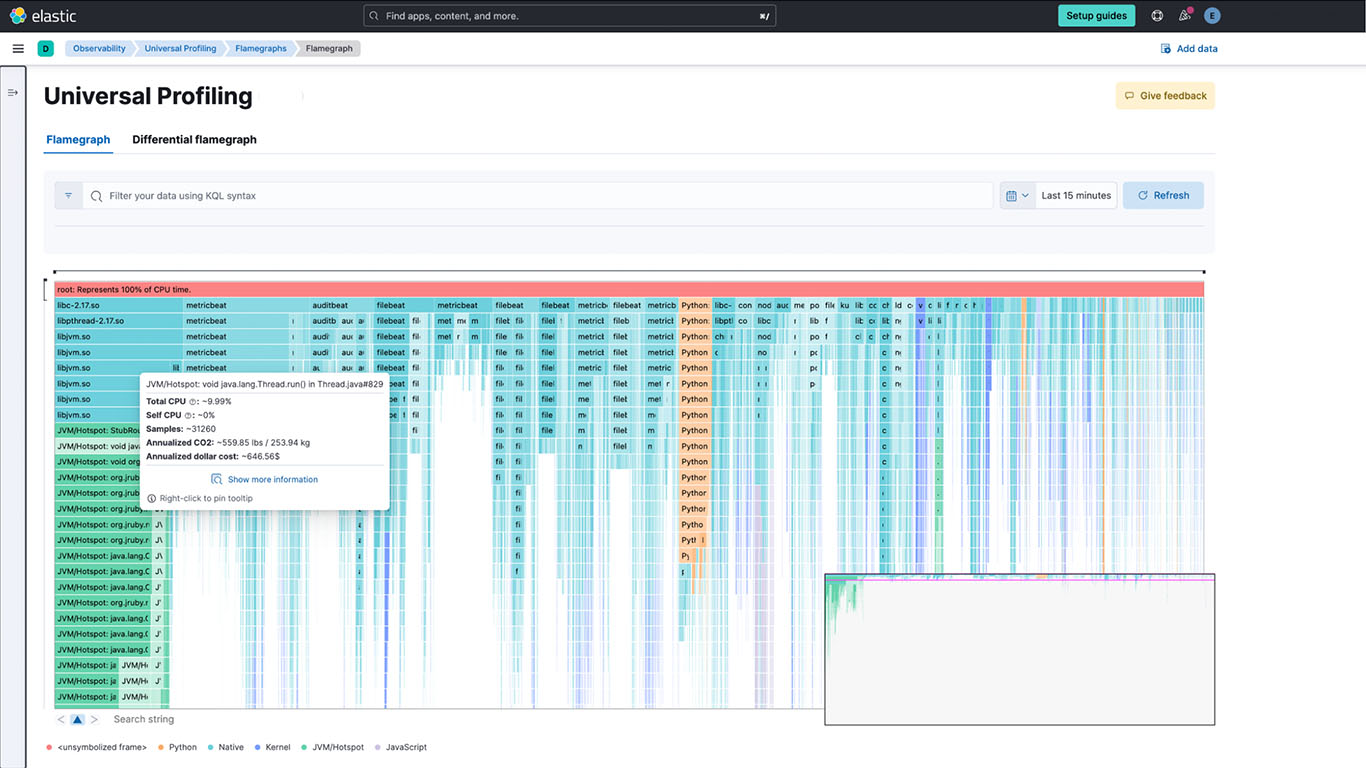
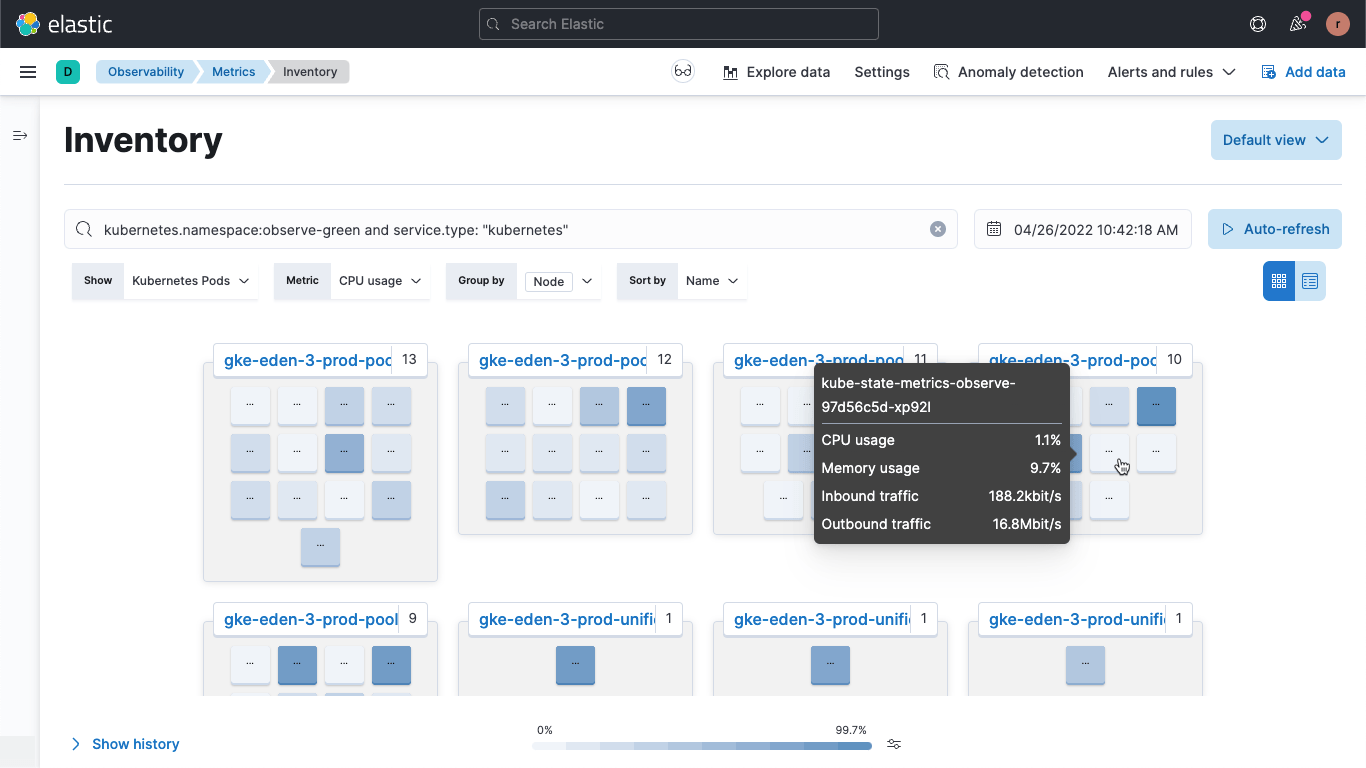
Seamlessly observe cloud-native and microservices technologies such as Kubernetes (K8s) and serverless. Correlate and map dependencies between your application and infrastructure and investigate issues with a single click. Optimize inefficient code and infrastructure configurations for reduced cloud spend and a more sustainable carbon footprint.
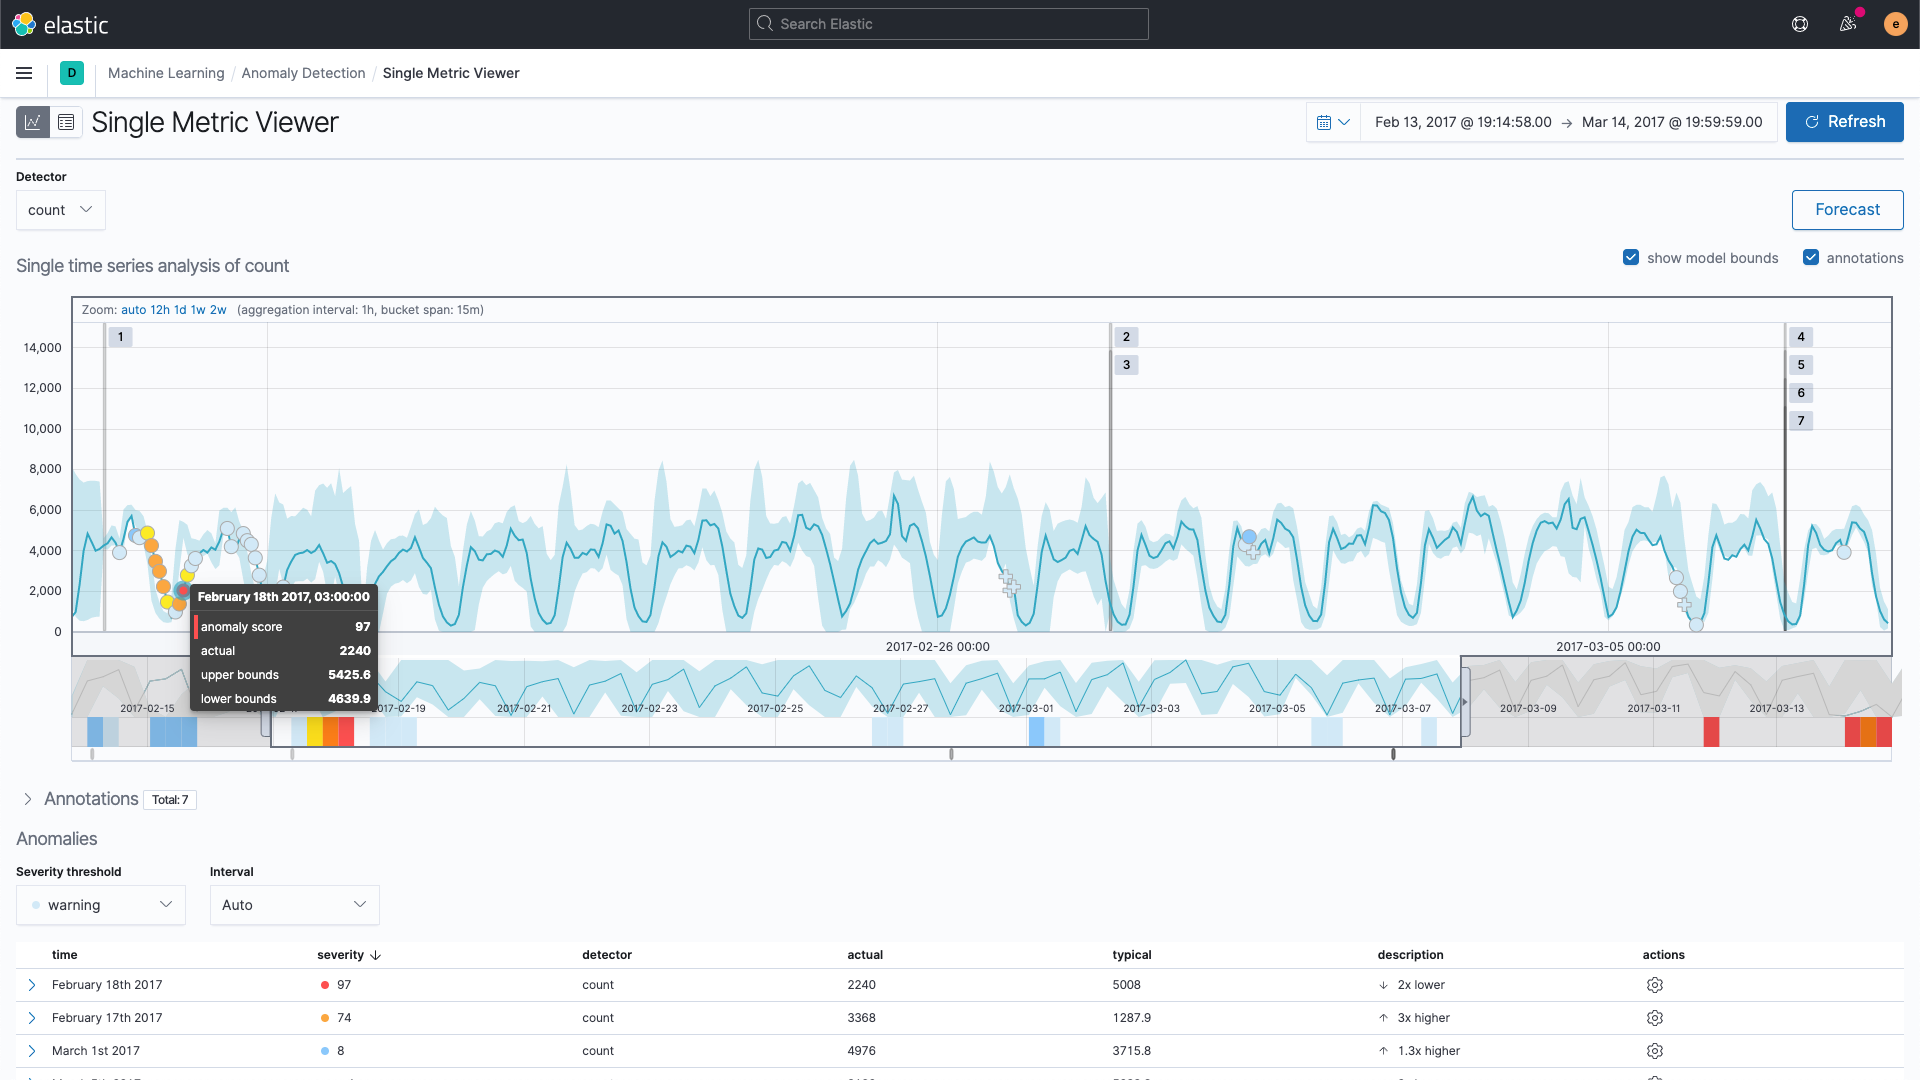
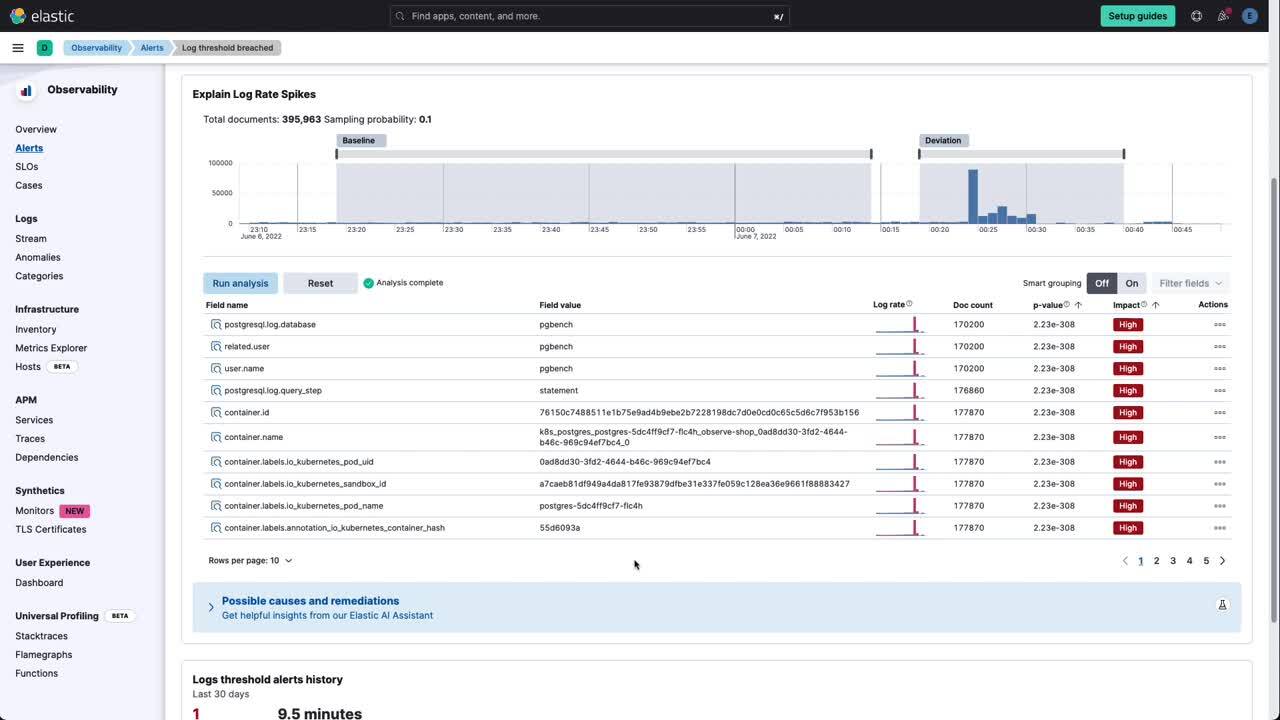
Take AIOps to the next level with interactive chat-based investigations, anomaly detection and correlations across all downstream data and dependencies. Automatically surface potential root causes of issues with over 100 out-of-the-box machine learning models. Easily extend machine learning to any data, whether business or operational, and improve productivity for developer, SRE, and DevOps teams.
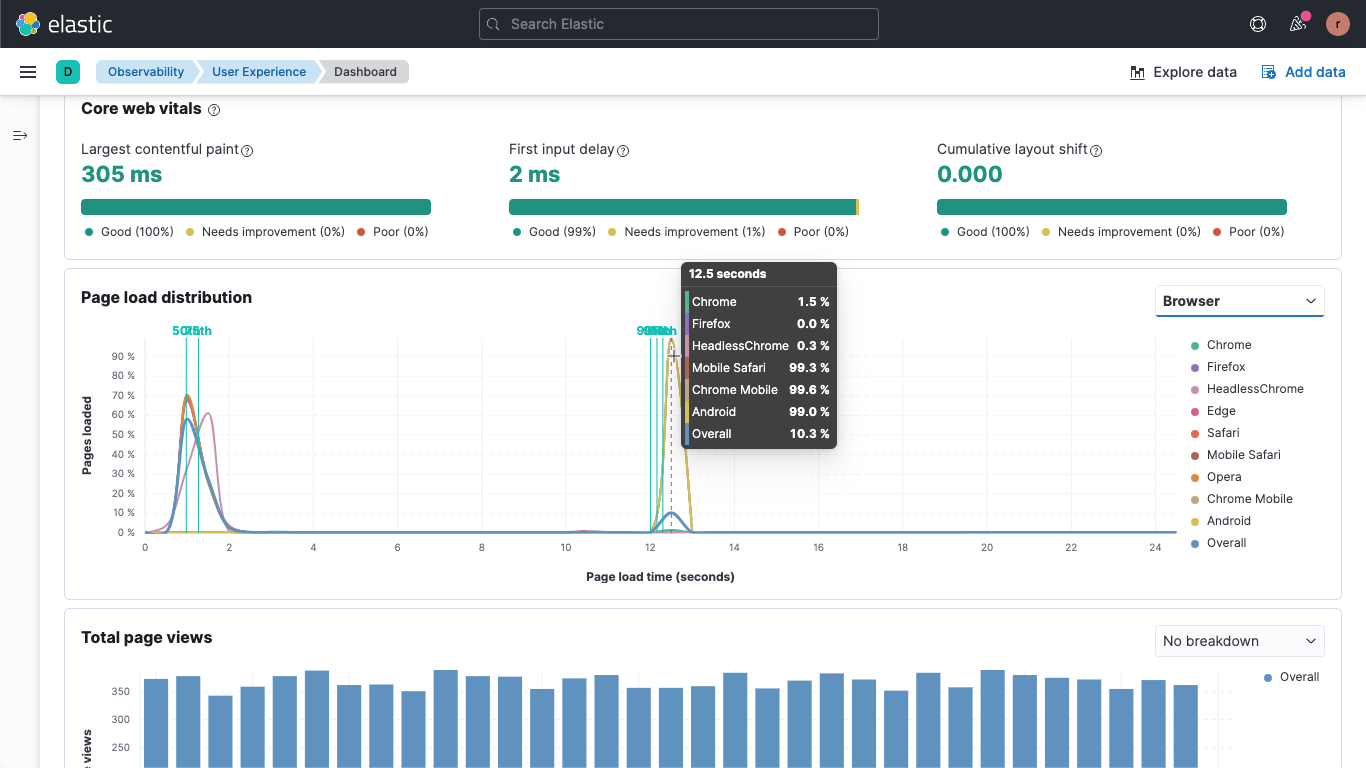
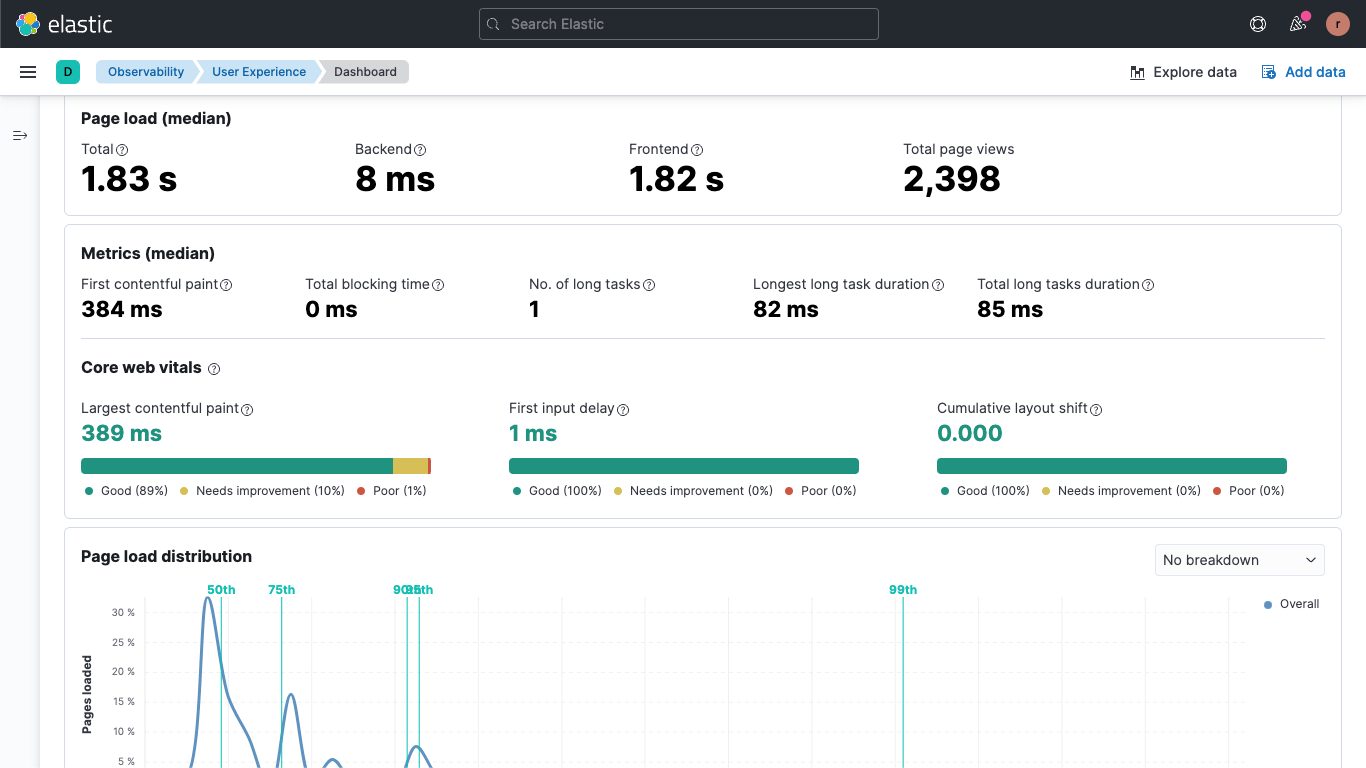
Proactively monitor user journeys and catch issues before your users do. Verify the health of hosts, services, and APIs. Track performance and availability across all regions and on all devices with metrics such as page loads, requests, and latency.
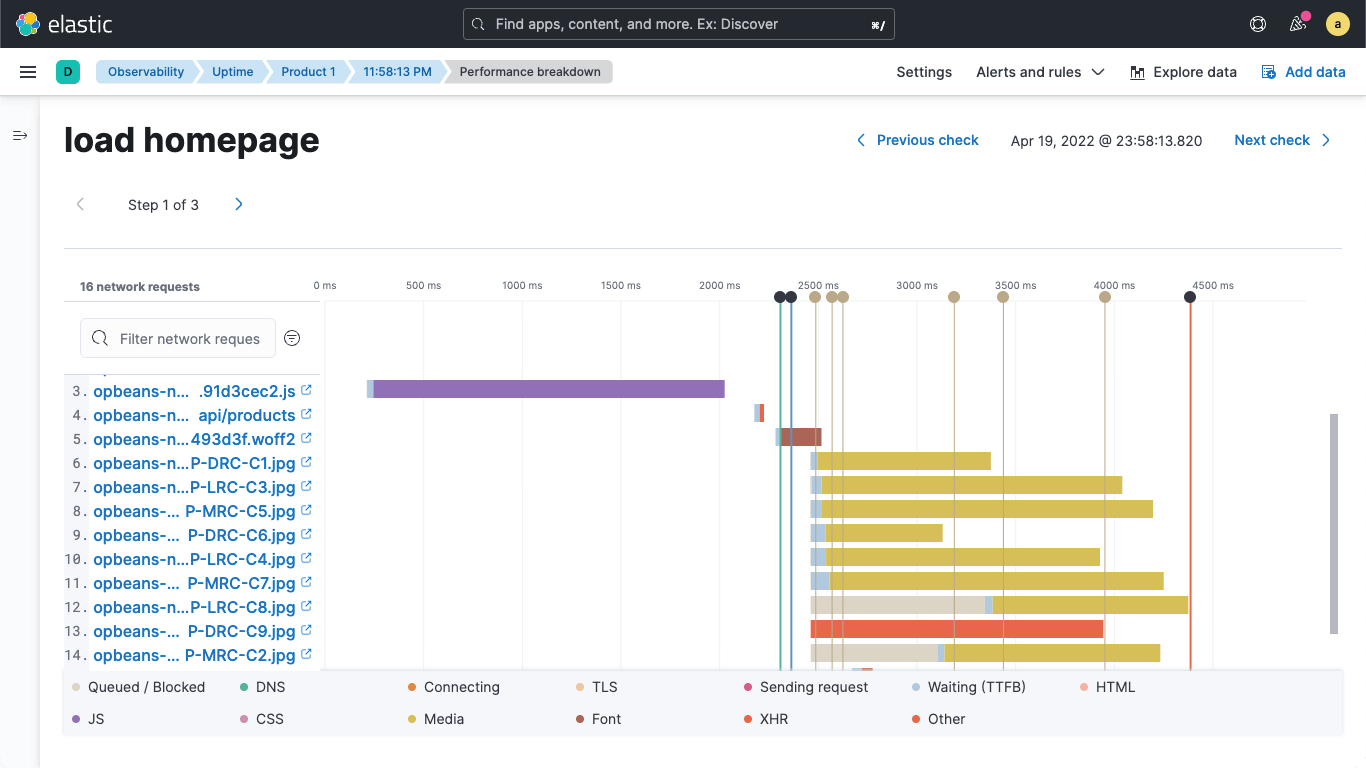
Ingest all your telemetry data with high cardinality and dimensionality. Add metadata for context, and analyze it in real time for fast root cause analysis and application optimization. Get actionable insights into your serverless, microservices, and cloud-native environments to optimize user experiences. Keep mission-critical applications running smoothly by finding and predictively resolving problems before they impact your business.

The Elastic advantage
Unparalleled scale and visibility with low TCO for DevOps, site reliability engineering (SRE), and software development teams. Instrument and observe everything. Automate analysis of all your data, correlated and in context — from the end-user to the infrastructure and in between. Quickly and easily find information, gain insights, and protect your investments.


Customer Spotlight
"We used to take days to find out where a problem was. Now we're doing it in a matter of minutes with Elastic, and our customers are the benefactors. This reduction in mean time to resolution was something we couldn't do with our legacy solutions."
– Ali Rey, Vice President of Cloud and Data Platforms, Emirates NBD
Customer Spotlight

"Elastic APM enables us to dig into how clients use your products in granular detail and apply this knowledge to make improvements to our service. For example, using traces, Sitecore can quickly identify performance bottlenecks across the entire application stack and implement improvements with surgical precision."
– Alex Stewart-James, Director - Technical Program Management, Sitecore
Customer Spotlight

"Together with experts from Devoteam, we have ensured that, by means of central Elastic Observability monitoring, De Watergroep has insight and control over crucial IT processes."
- Frank Coucke, Team Manager Integration, Monitoring & BI at De Watergroep


Transform your data into actionable insights using Elastic observability.